The Problem
Diffusion MRI measures the movement of water molecules in tissue, making it a powerful technique for studying brain structure and detecting conditions like stroke and neurodegenerative disease. Advanced diffusion models have been proposed to capture complex tissue features, but they are more prone to variation, raising concerns about measurement consistency and reliability. Currently, there is no standardized method to perform quality assurance on diffusion MRI data, and limited studies exist measuring the repeatability of higher-order tensor metrics.
The Solution
A novel anisotropic phantom containing synthetic fibre bundles with controlled geometries (linear, crossing, and branching) mimics white matter tracts in the brain. The phantom was scanned 11 times on a 3.0T GE MRI scanner using multiple acquisition protocols. A Python-based analysis pipeline performed automated ROI analysis and metric extraction. Repeatability was quantified using coefficient of variation (CoV) and intraclass correlation coefficient (ICC), establishing reliability benchmarks that inform quality assurance standards for clinical and research diffusion MRI.
Publications & Presentations
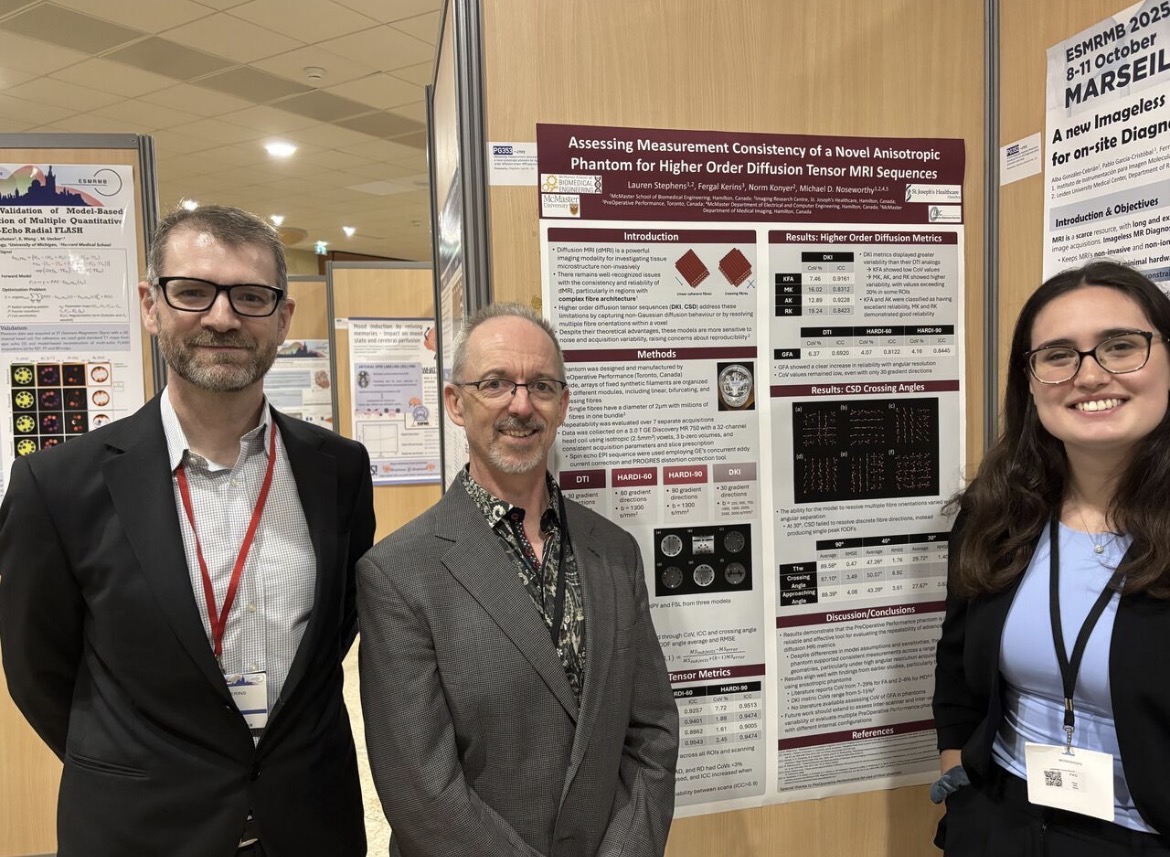
Poster presented at the European Society for Magnetic Resonance in Medicine and Biology Annual Meeting (in Marseille, France on October 8-11, 2025).
Research Overview
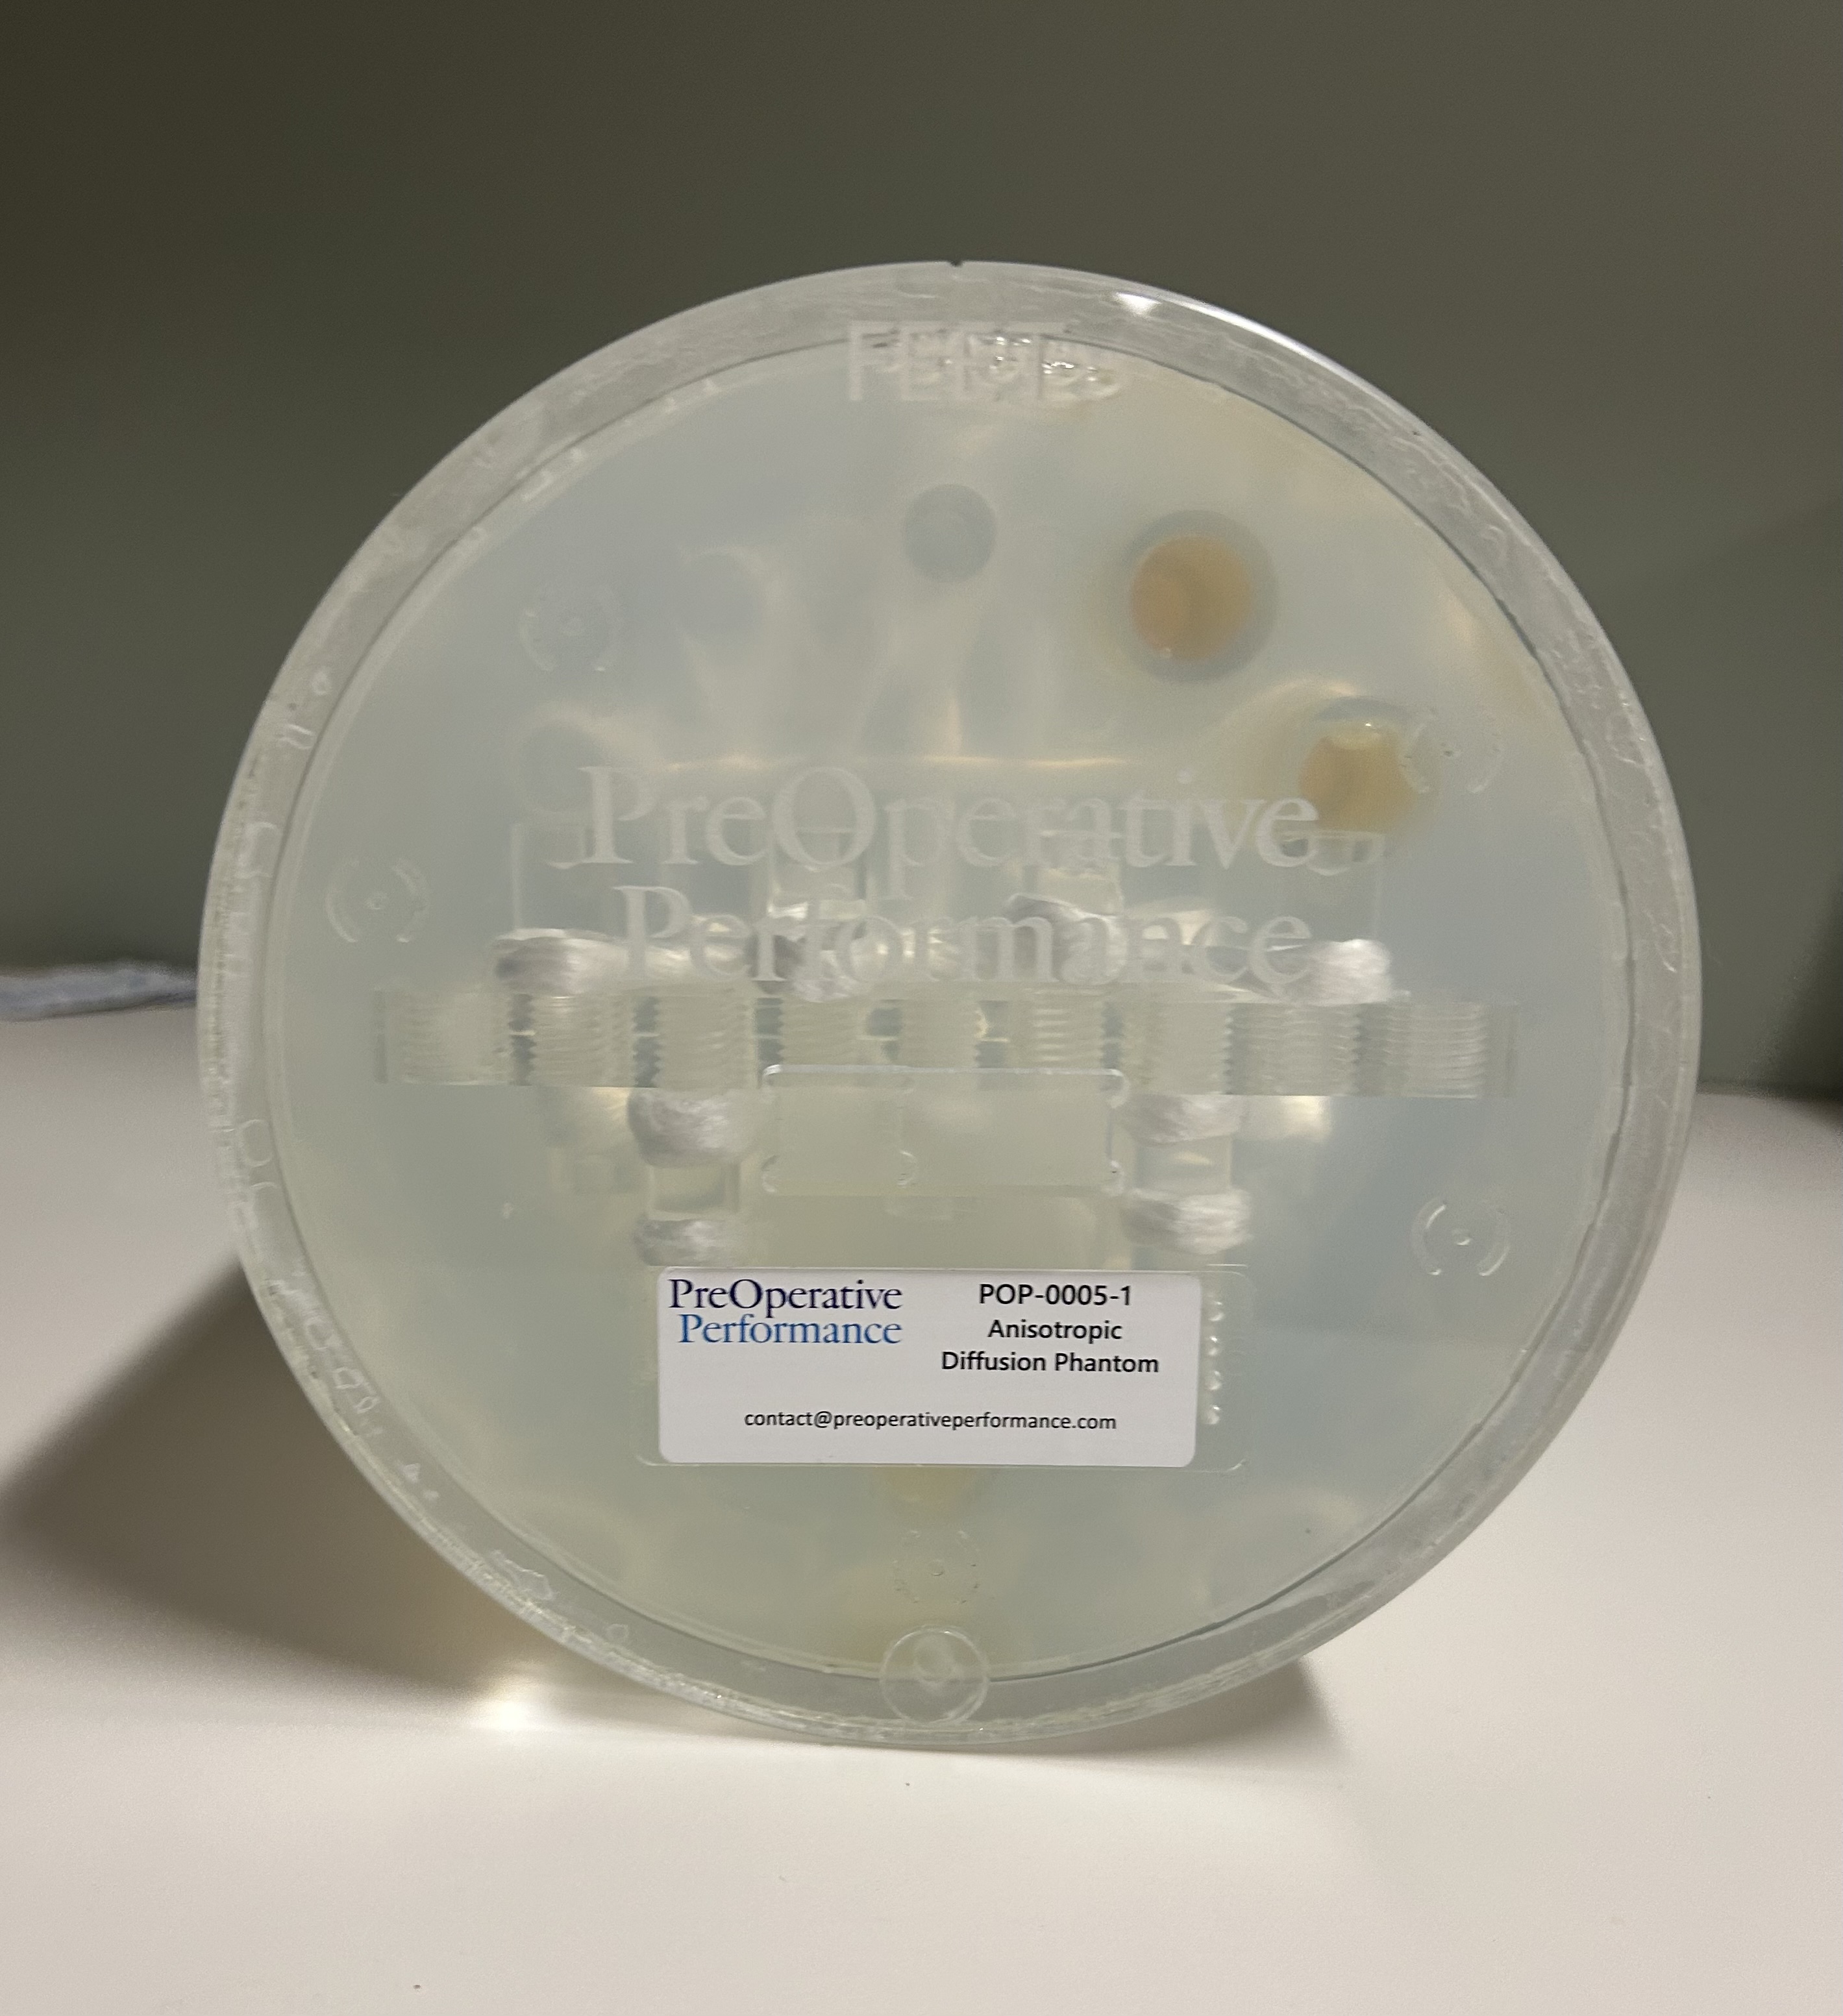
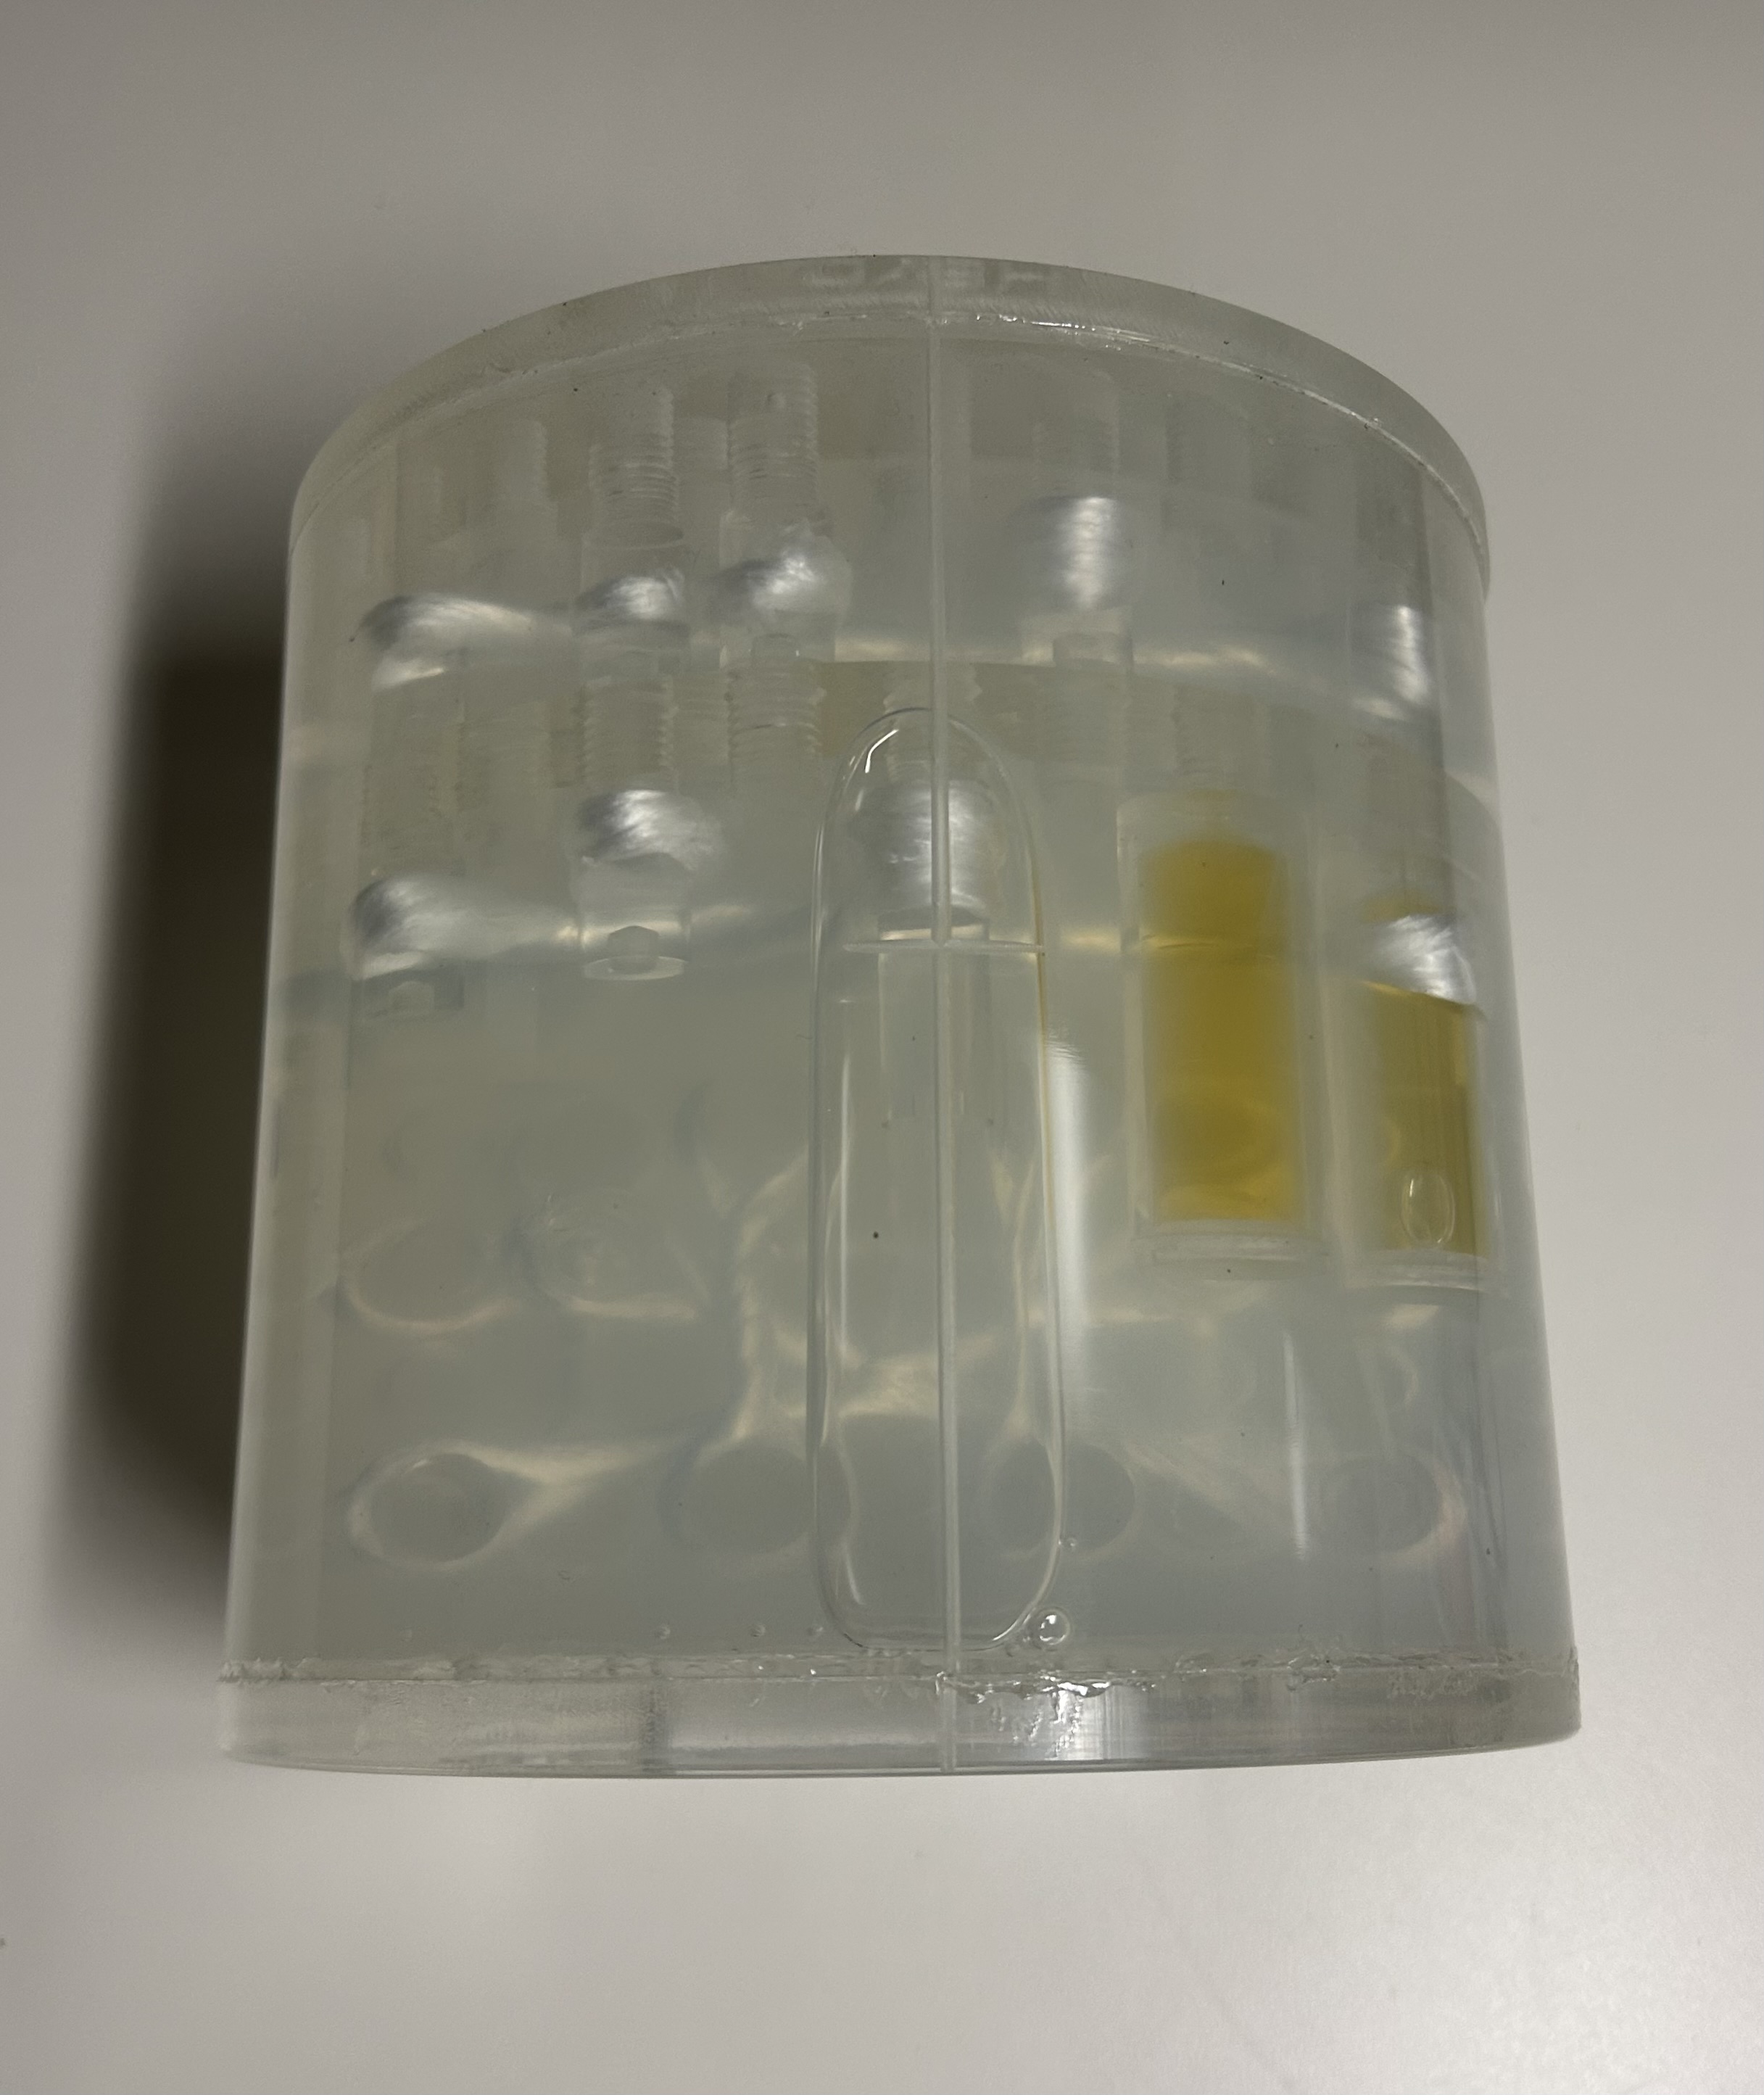
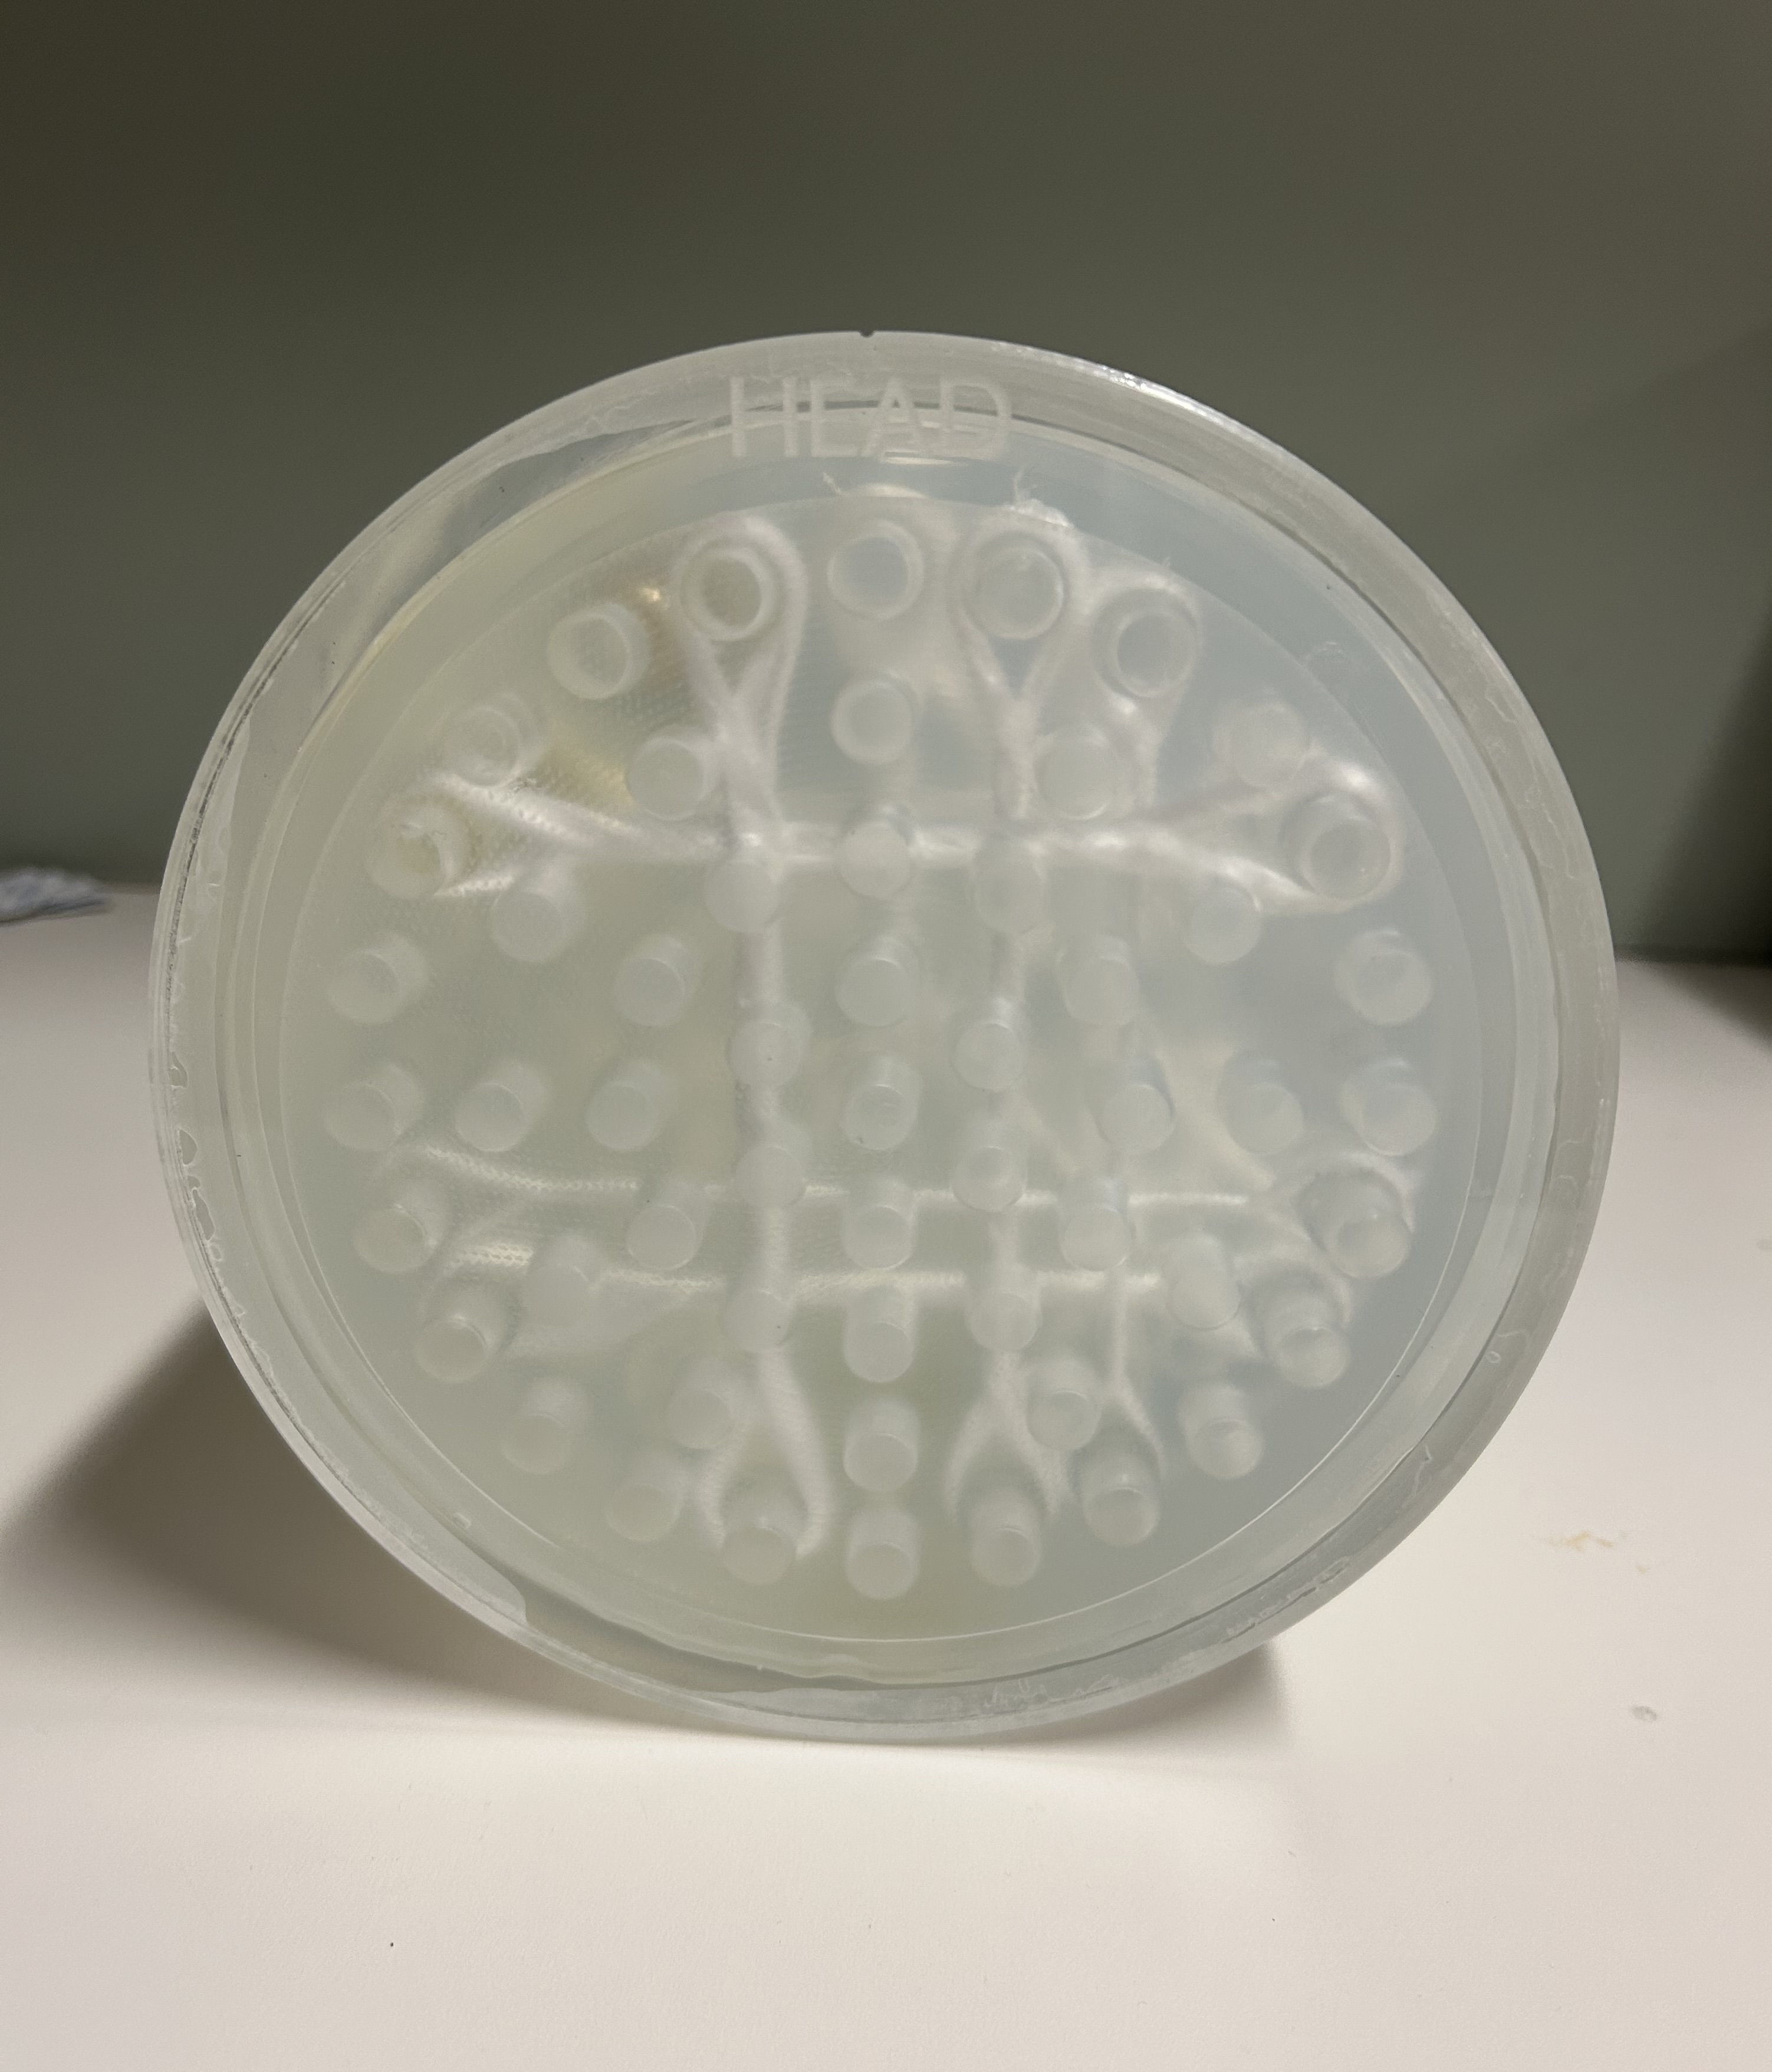
Front, lateral, and rear view photographs of the PreOperative Performance phantom.
This thesis evaluates three diffusion MRI modelling approaches (DTI, DKI, and CSD) across multiple scanning protocols to determine which metrics are sufficiently stable for clinical quality assurance. By testing regions with varying complexity, from simple parallel fibres to a variety of crossing angles, the study identifies which measurements can reliably track disease progression or treatment response in patient populations.
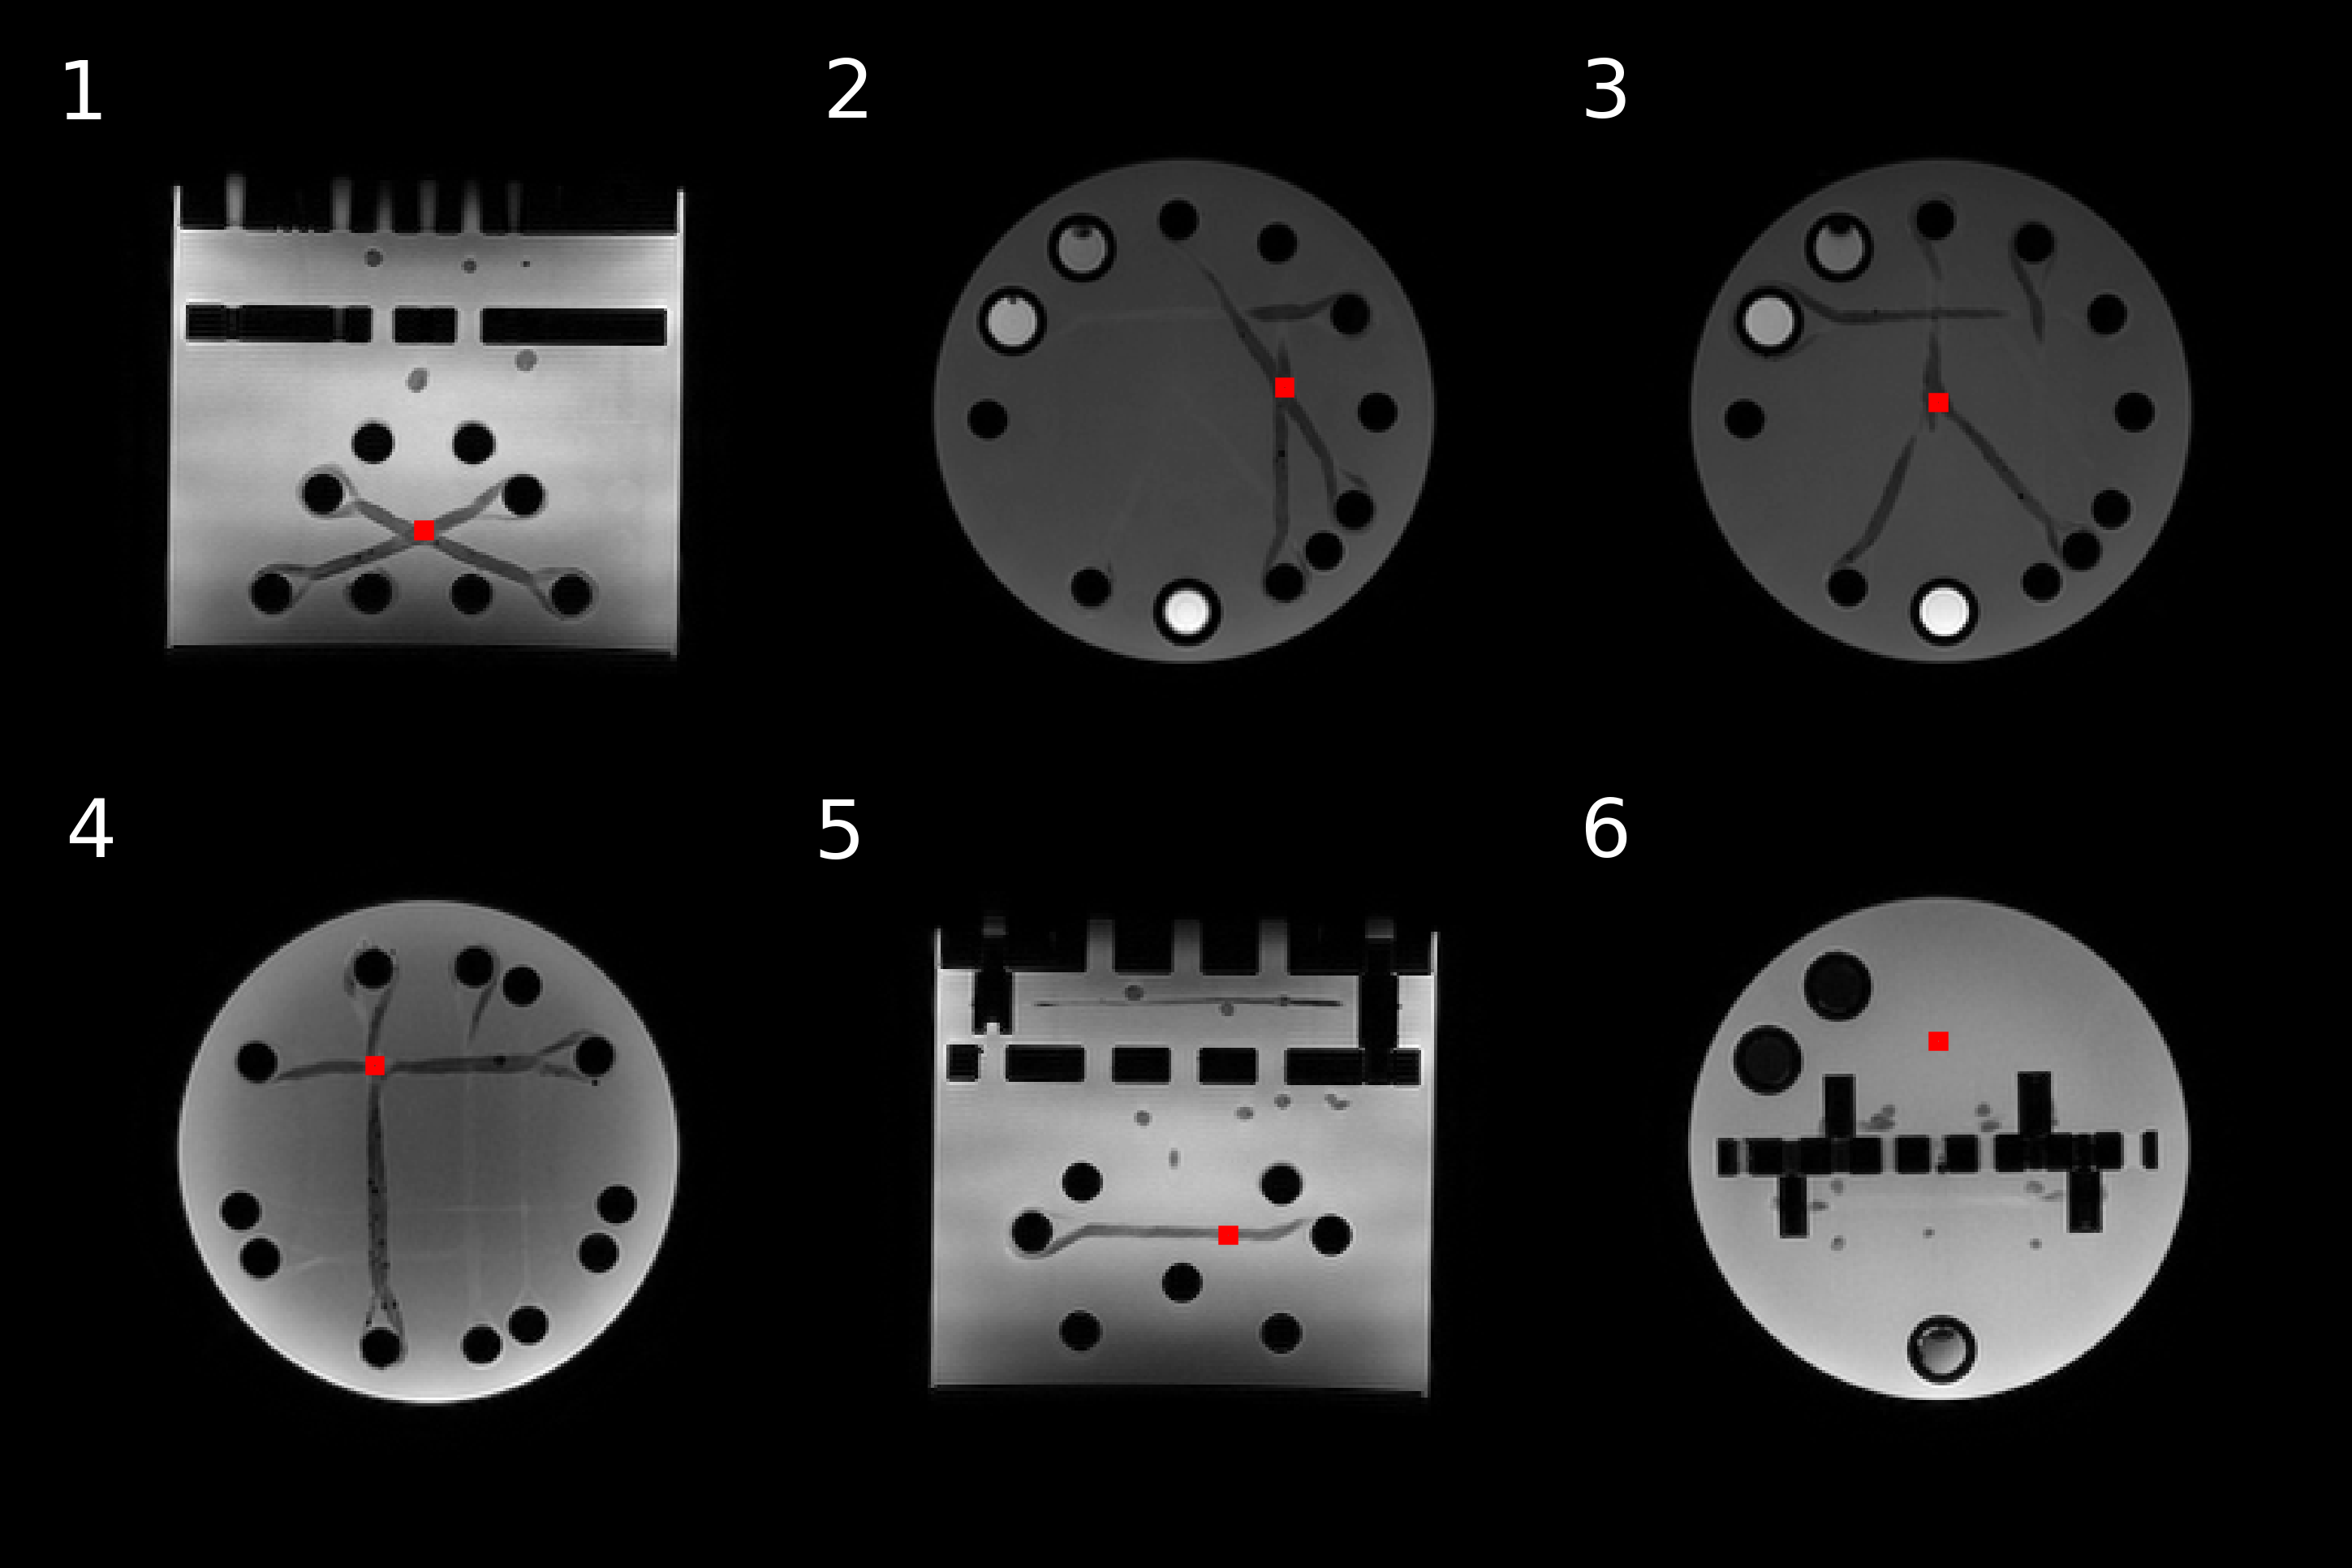
T1-weighted image with ROIs shown in red. (1) 90° intersection in the XY plane. (2) 45° intersection in the XZ plane. (3) 30° intersection in the XY plane. (4) Fibre splitting into three small fibre bundles. Two fibres split into the XY plane (pictured), and one fibre splits out-of-plane. (5) Simple linear fibre in the Y plane. (6) Isotropic area with no fibres present.
Skills Applied
Background on Diffusion MRI
Diffusion MRI was first demonstrated in humans in 1986 and has since become essential for studying brain structure. Water molecules naturally move through random thermal motion (Brownian motion), and their movement is restricted by biological barriers like cell membranes and axonal fibres. By applying magnetic field gradients, MRI can measure this directional water movement.
In the brain:
- Isotropic diffusion occurs in cerebrospinal fluid (equal movement in all directions)
- Anisotropic diffusion occurs along white matter tracts (preferential movement along fibres)
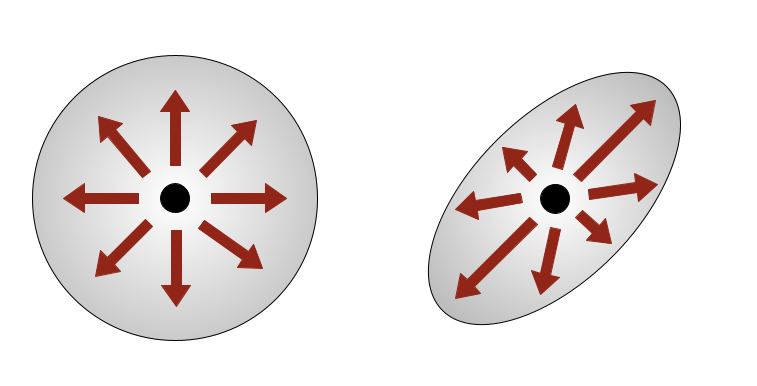
Illustration of isotropic (left) and anisotropic (right) diffusion.
The Crossing Fibre Problem
Traditional DTI assumes water diffuses in a single primary direction per voxel, which breaks down in regions where multiple fibre bundles cross, kiss, or branch. Estimates suggest 33-90% of white matter voxels contain crossing fibres, making this a fundamental limitation for brain connectivity studies.
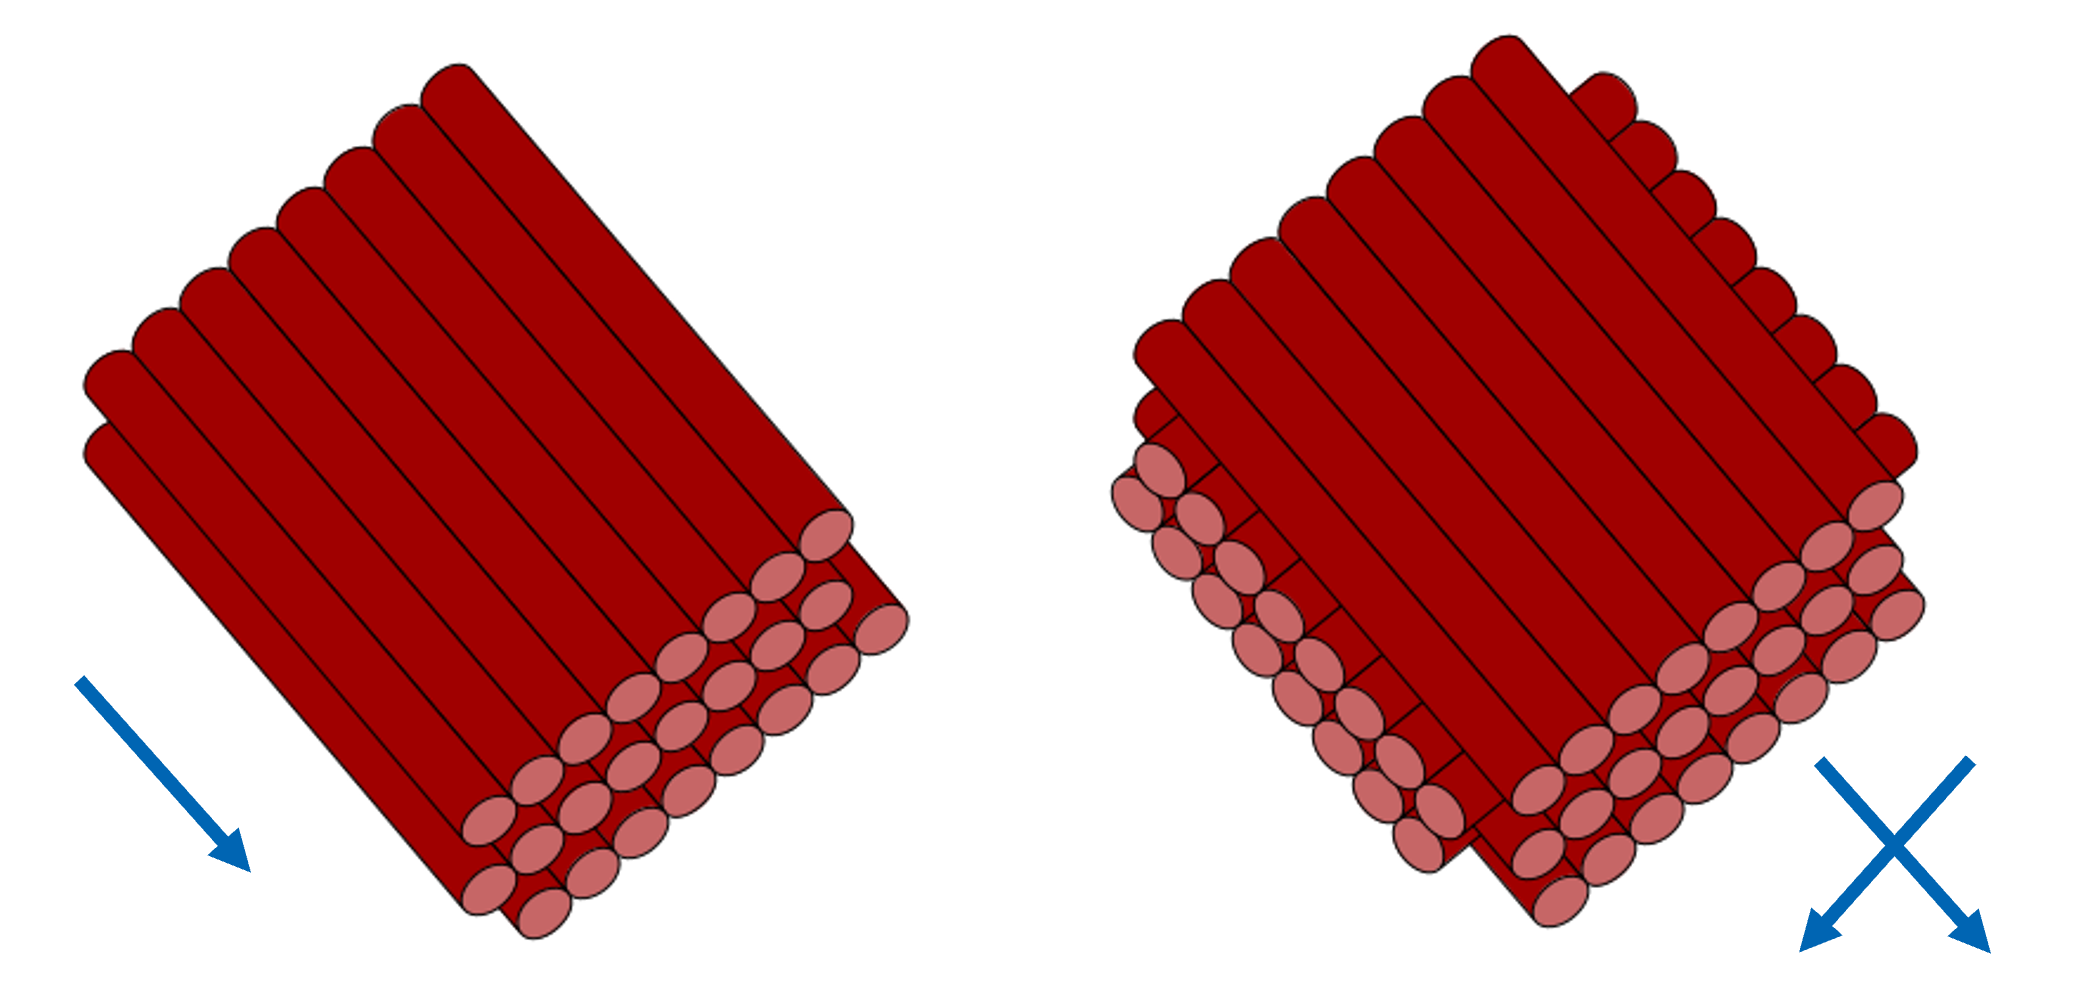
Schematic of aligned linear fibres (left) and crossing fibres (right).
Advanced models address this limitation but require:
- More complex data acquisition (more gradient directions, multiple b-values)
- Longer scan times
- More sophisticated analysis
This thesis evaluated three diffusion models:
- DTI (Diffusion Tensor Imaging) - Standard model assuming single fibre direction per voxel
- DKI (Diffusion Kurtosis Imaging) - Captures non-Gaussian diffusion behaviour
- CSD (Constrained Spherical Deconvolution) - Resolves multiple crossing fibres
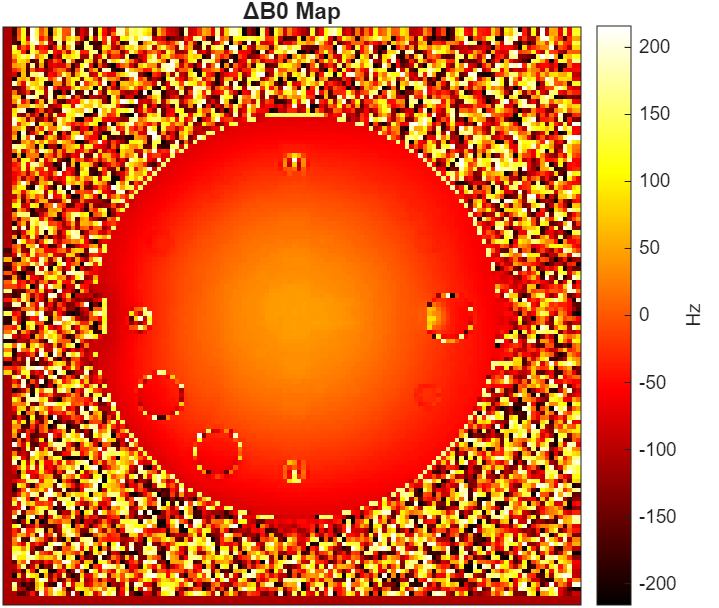
Methodology
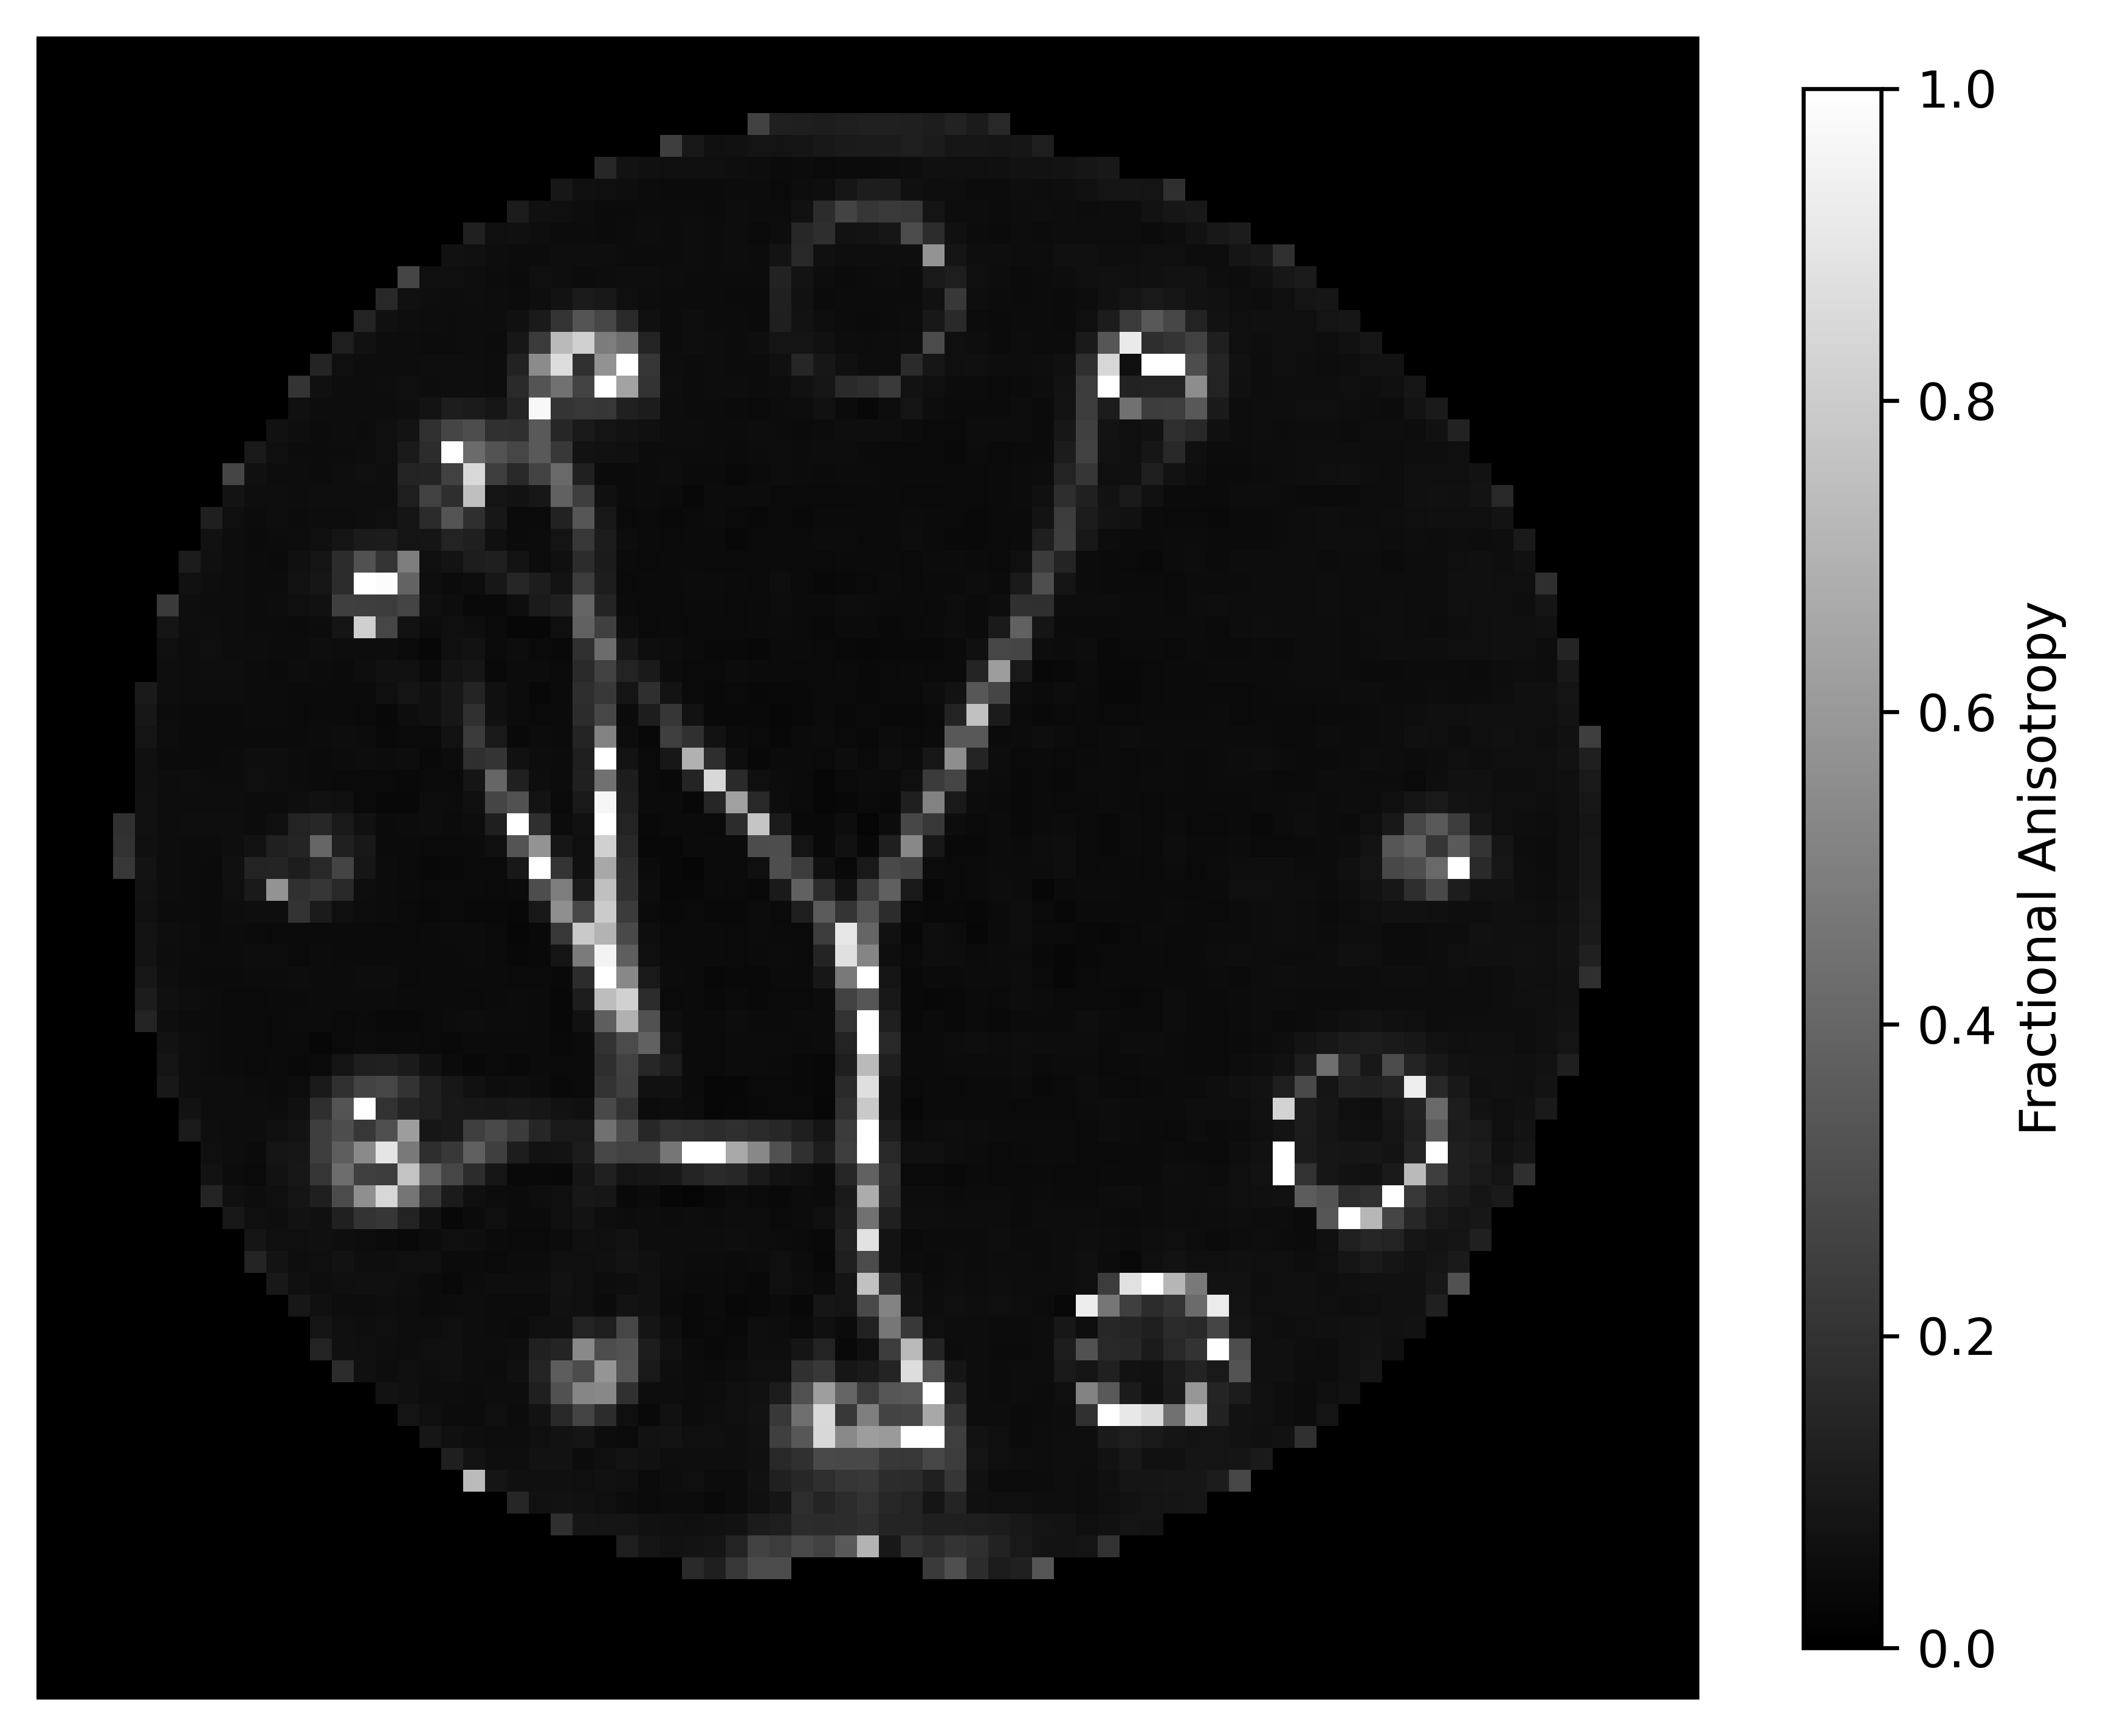
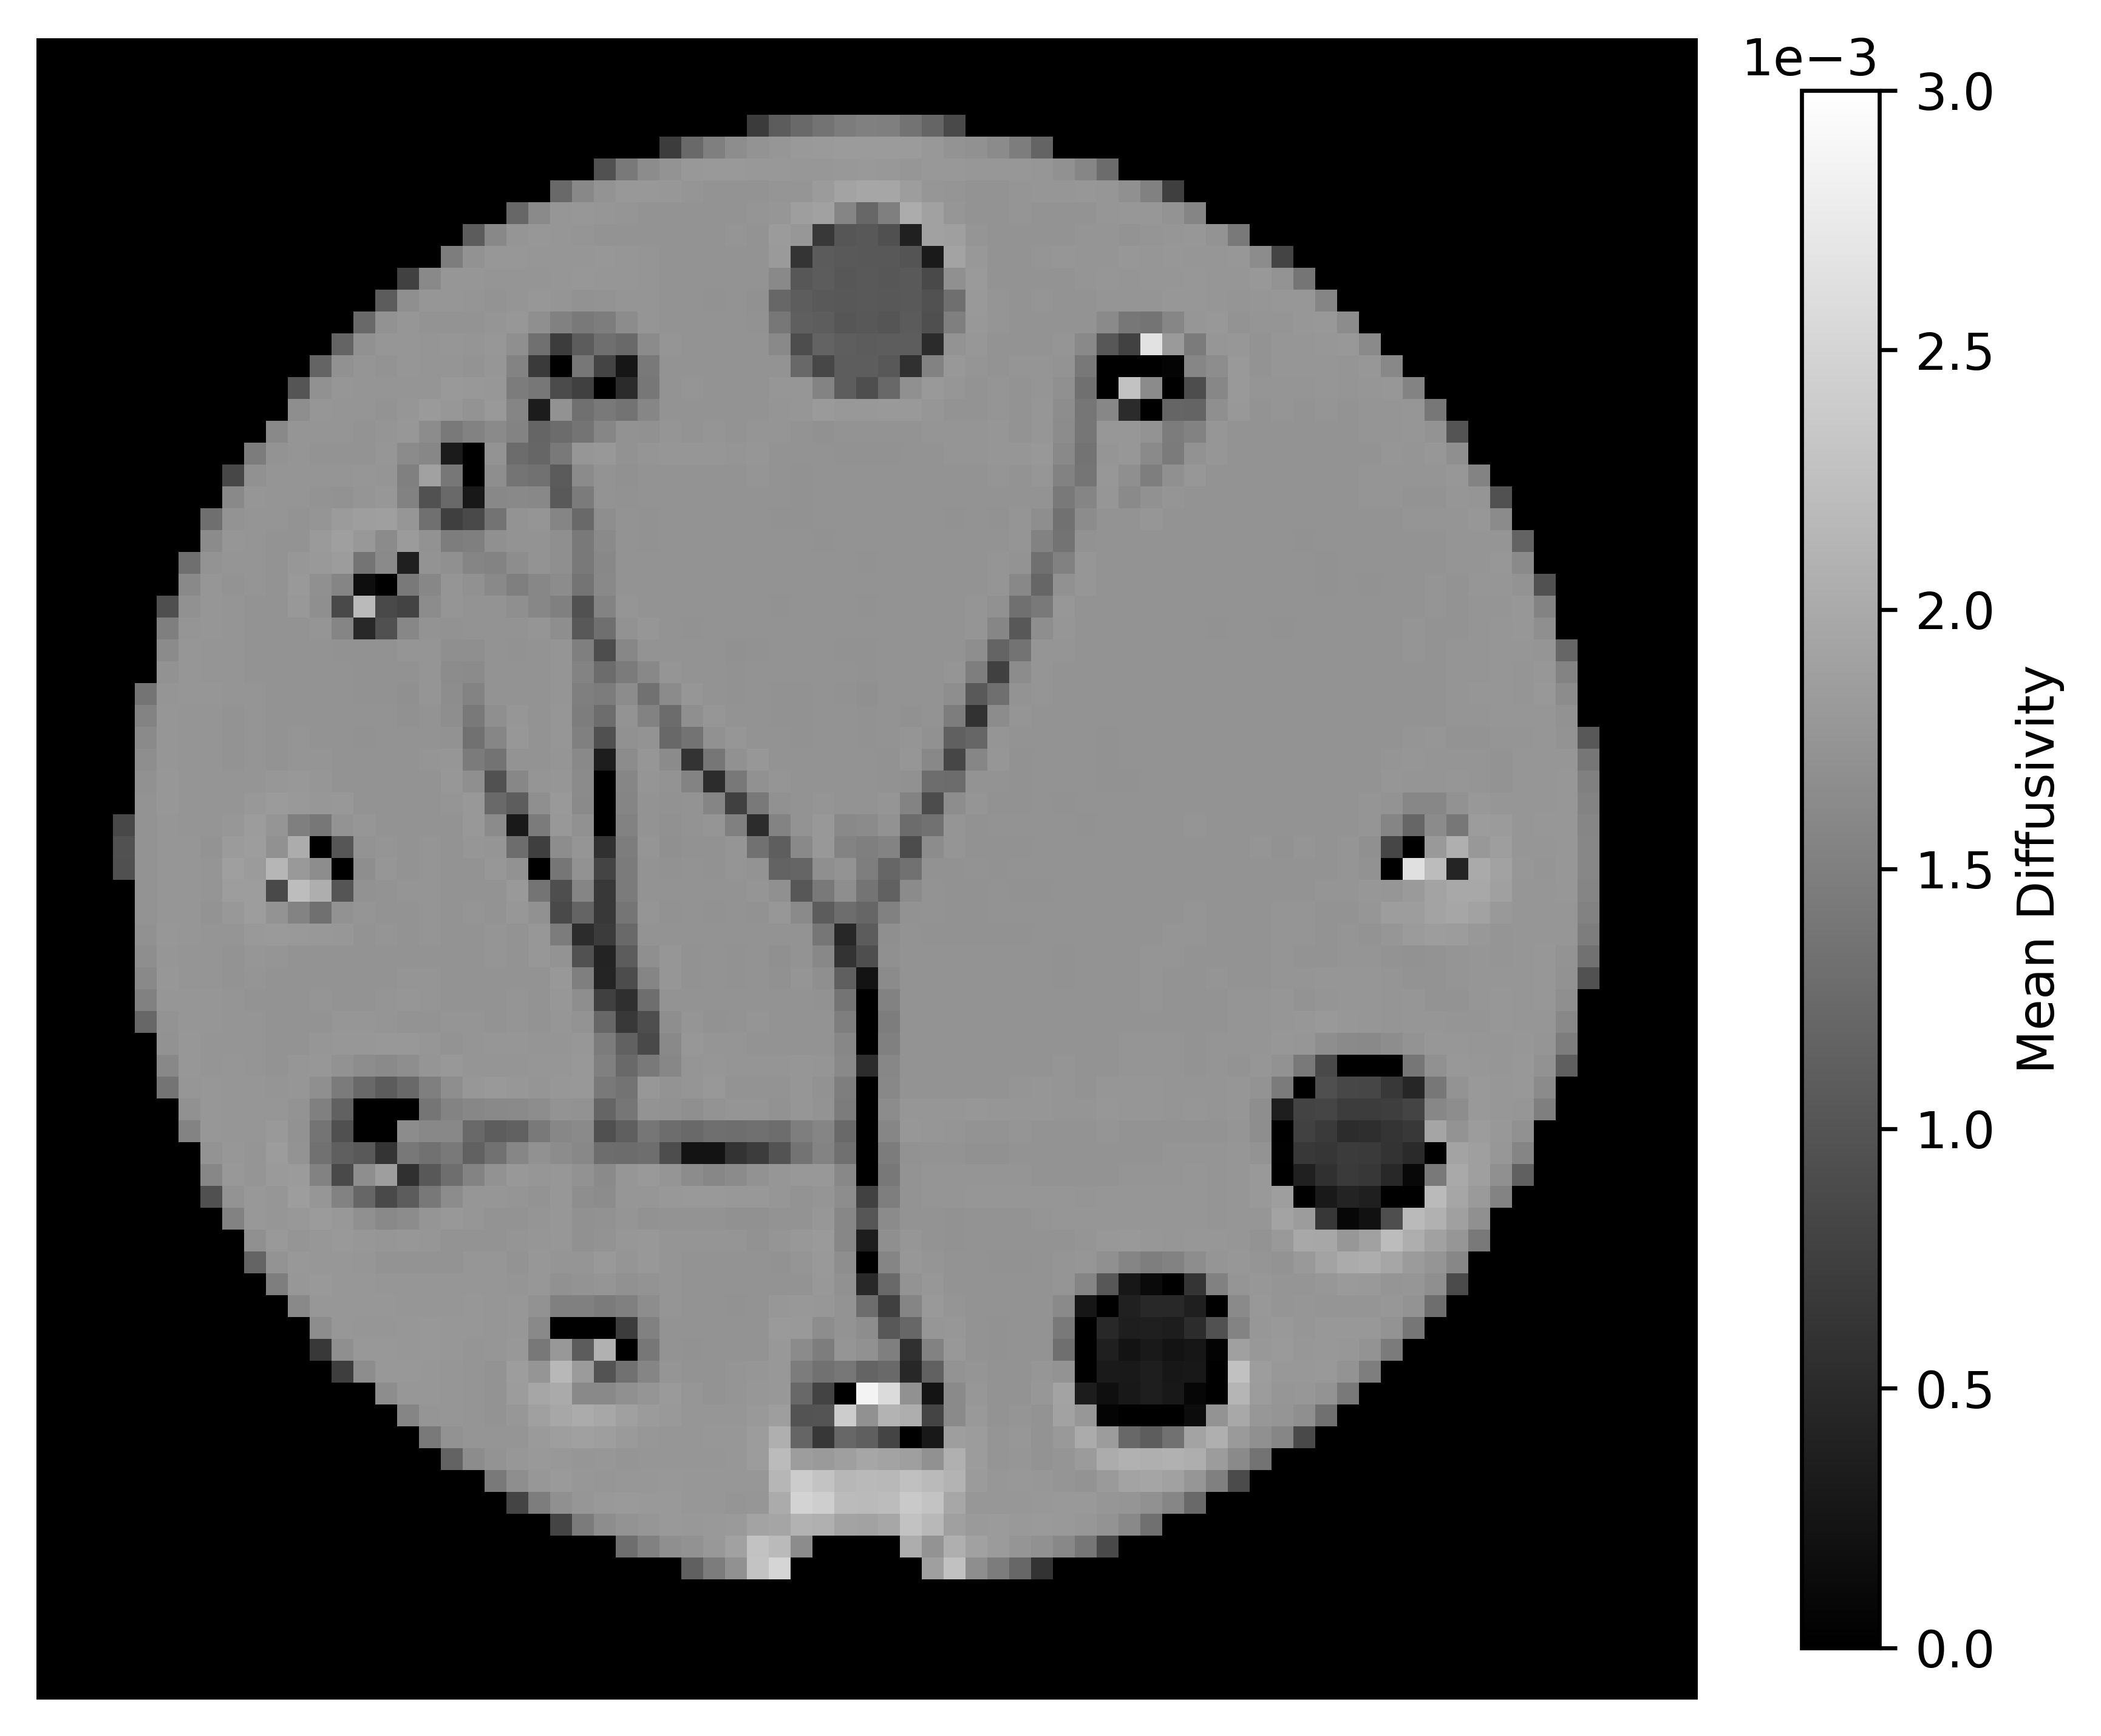

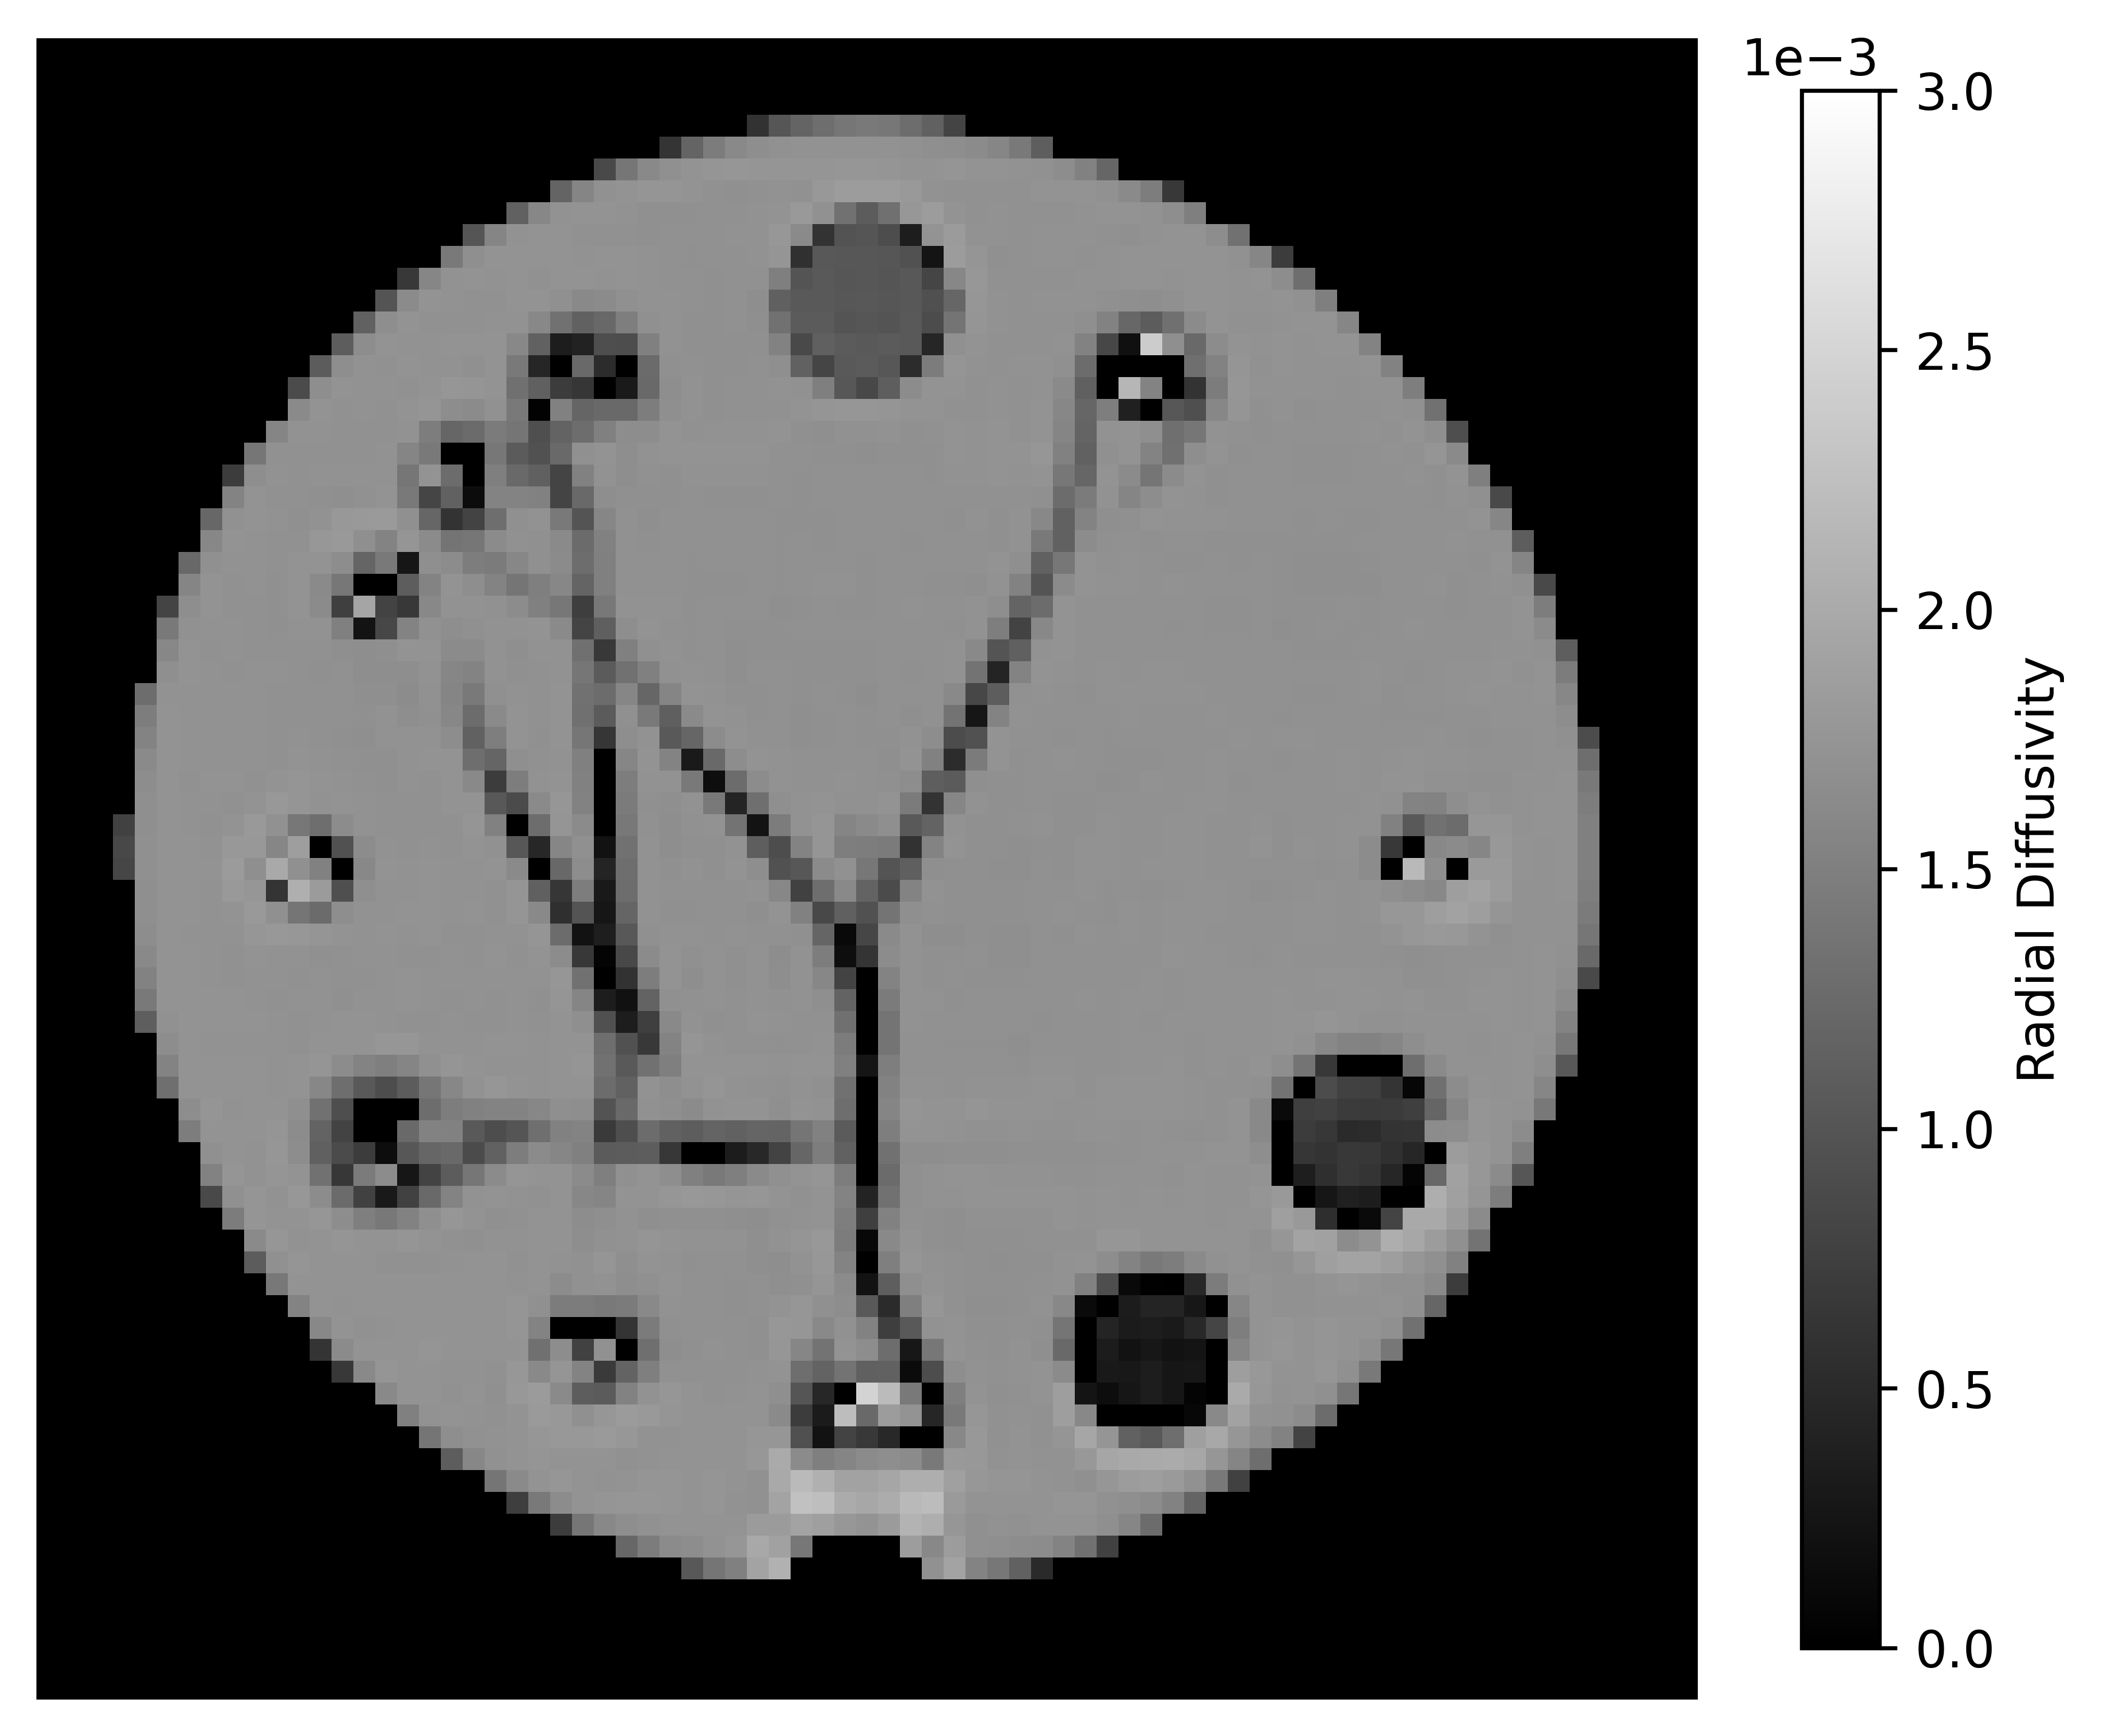
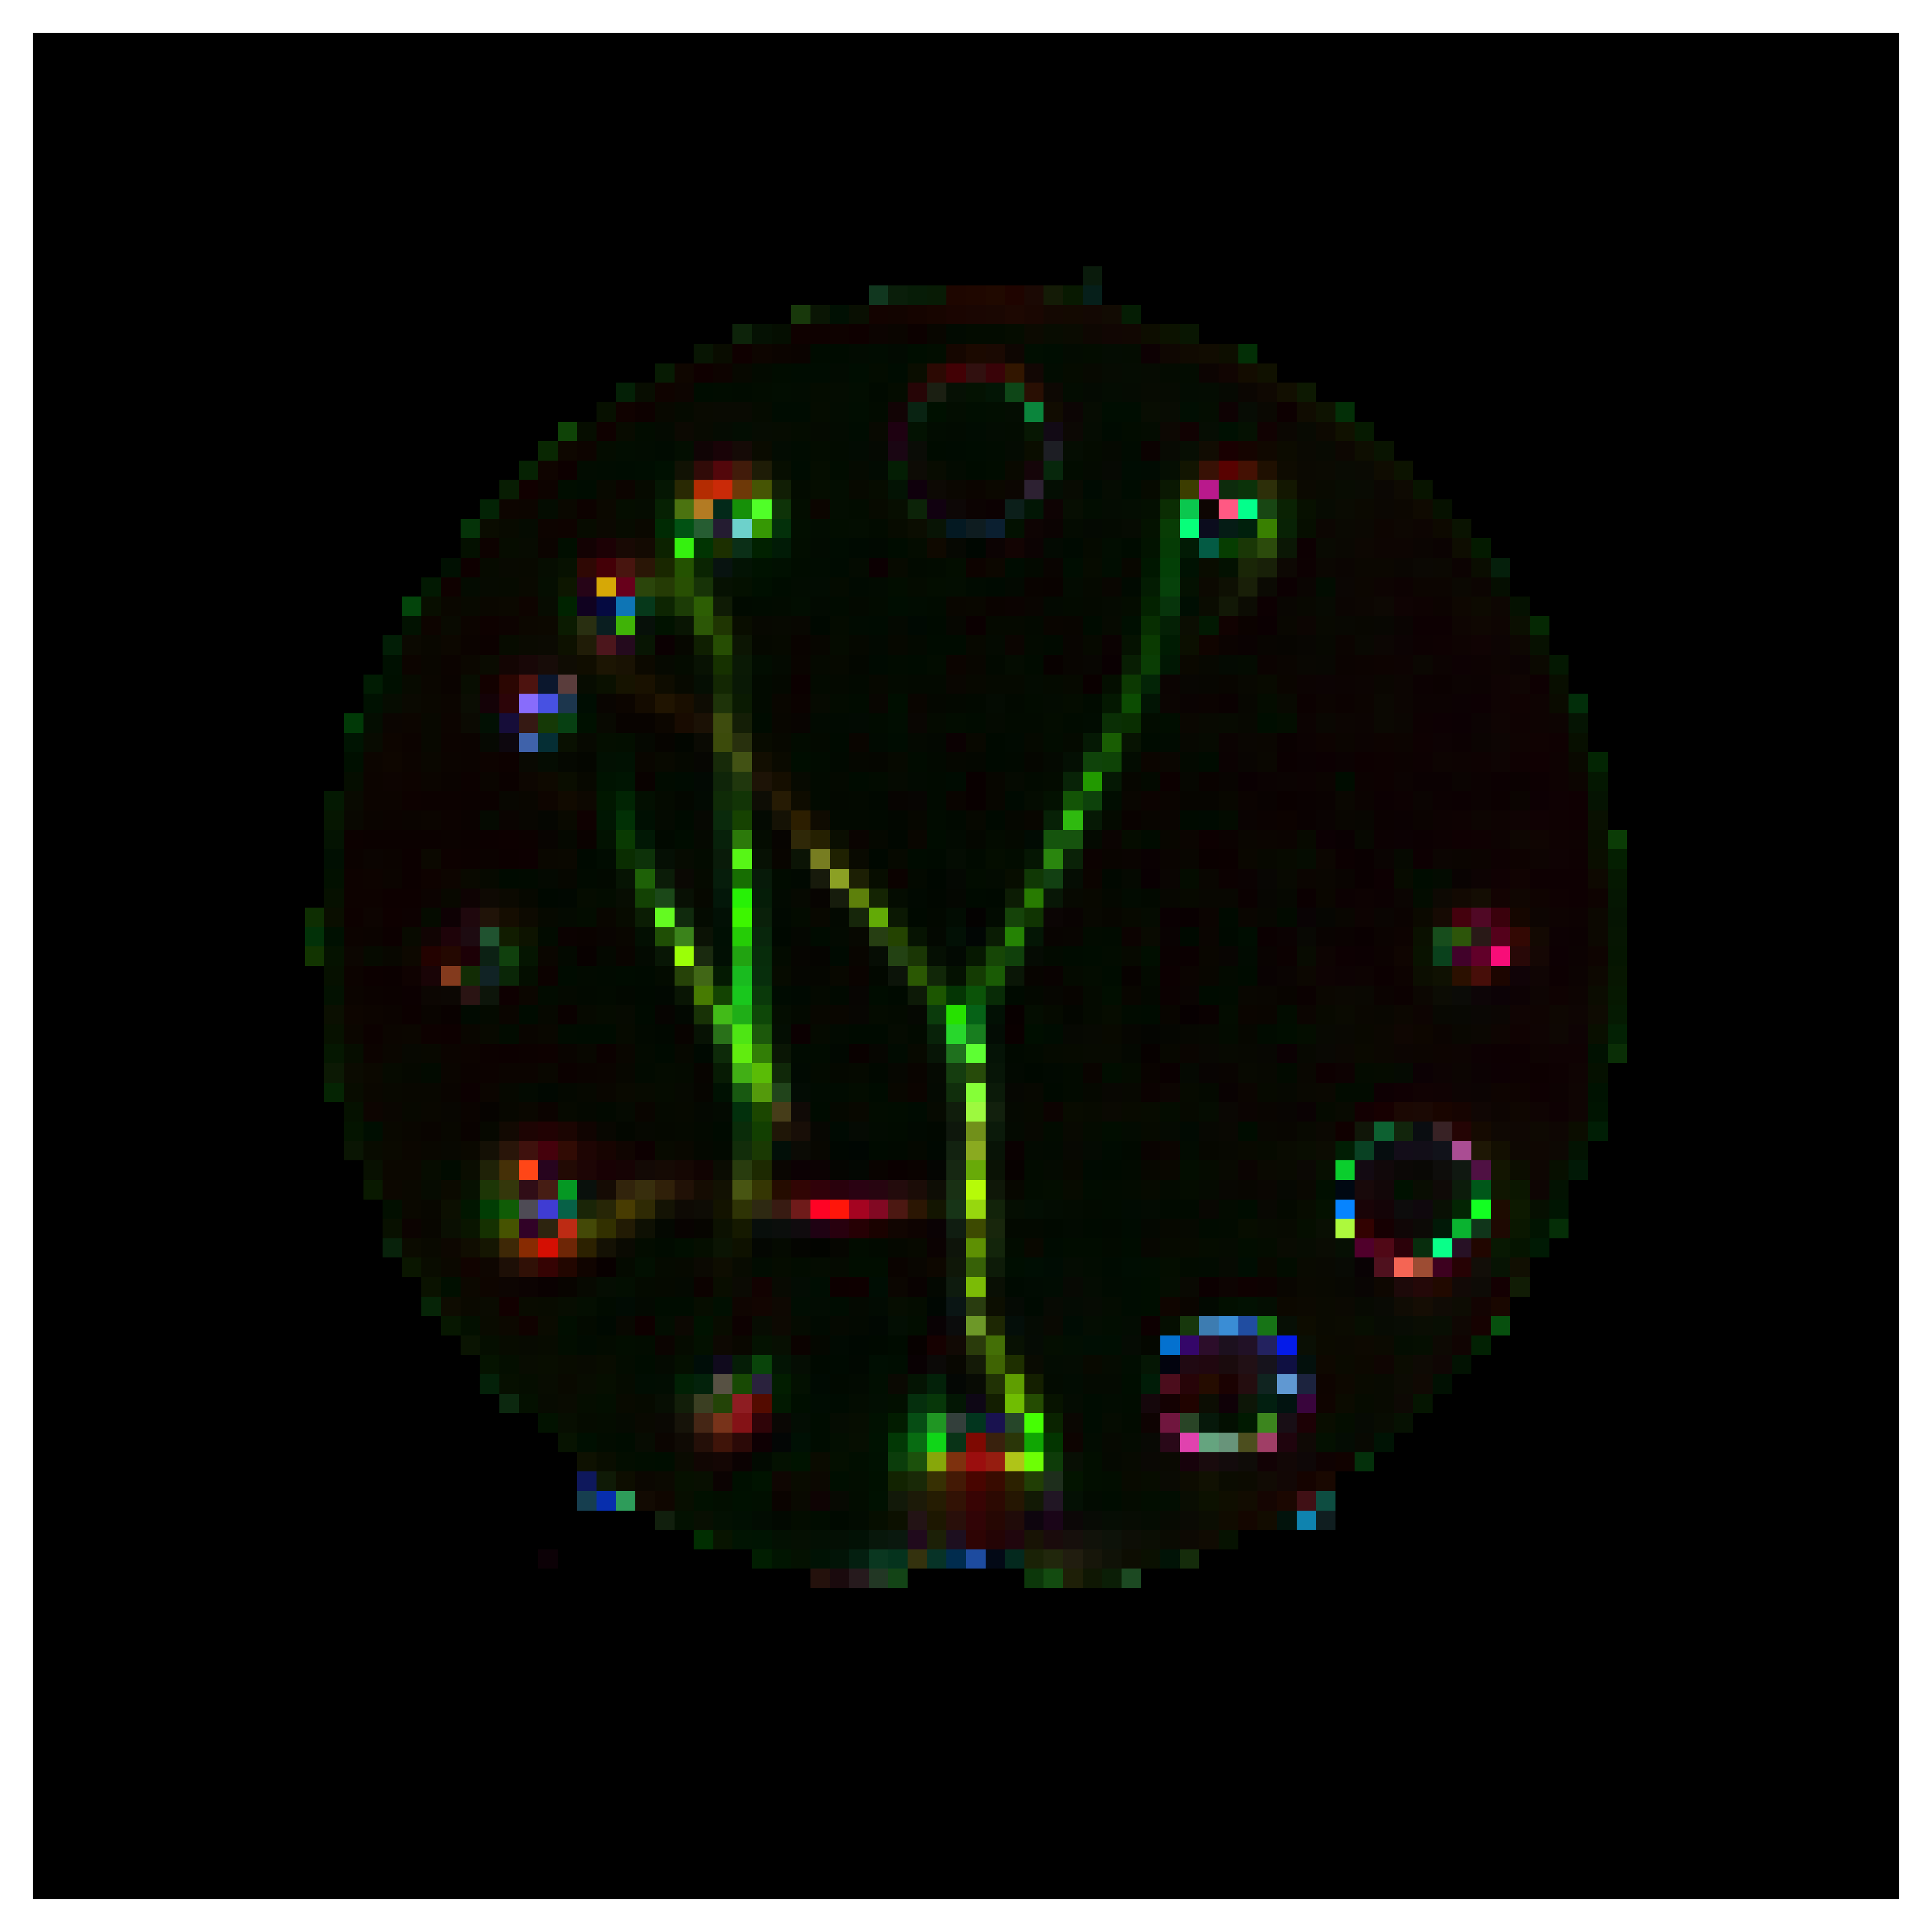
DTI–derived parameter maps from a single slice of the phantom (FA, MD, AD, and RD in order).
Scanning Protocol
Each of 11 imaging sessions included:
- 30-direction DTI: Standard clinical protocol (b=1000 s/mm²)
- 60-direction HARDI: High angular resolution (b=1300 s/mm²)
- 90-direction HARDI: Very high angular resolution (b=1300 s/mm²)
- Multi-shell DKI: 30 directions at 8 b-values (b=250-3000 s/mm²)
Data Analysis Pipeline
- Preprocessing: MP-PCA denoising, eddy current correction, masking
- Model Fitting: Applied DTI, DKI, and CSD models using DIPY library
- Metric Extraction: Computed scalar metrics (FA, MD, MK, GFA, etc.)
- Statistical Analysis: Calculated CoV and ICC to quantify repeatability
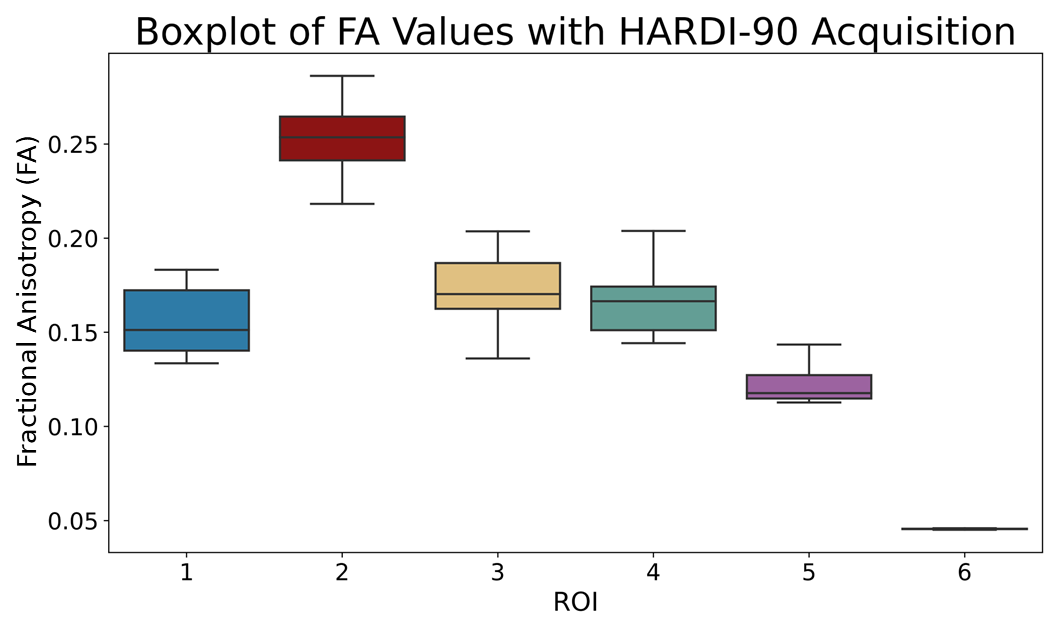
Results: Rank-2 Tensor Metrics
These metrics showed high repeatability across all ROIs and scanning protocols. FA exhibited CoVs below 10% while MD, AD, and RD had CoVs below 3%. The overall trend shows CoV decreased and ICC increased when using HARDI acquisitions. All ICC values showed excellent reliability between scans (ICC > 0.9) when using the HARDI-90 protocol.
| Metric | DTI | HARDI-60 | HARDI-90 | |||
|---|---|---|---|---|---|---|
| CoV % | ICC | CoV % | ICC | CoV % | ICC | |
| FA | 9.45 | 0.9303 | 9.06 | 0.9257 | 7.72 | 0.9513 |
| MD | 2.06 | 0.9336 | 1.95 | 0.9401 | 1.89 | 0.9474 |
| AD | 1.72 | 0.8154 | 1.51 | 0.8862 | 1.61 | 0.9005 |
| RD | 2.40 | 0.9431 | 2.32 | 0.9543 | 2.45 | 0.9474 |
Results: Higher Order Diffusion Metrics
DKI metrics displayed greater variability than their DTI analogs. KFA showed low CoV values and excellent ICC reliability. MK, AK, and RK showed higher variability, with values exceeding 30% in some ROIs. KFA and AK were classified as excellent reliability while MK and RK demonstrated good reliability.
| Metric | CoV % | ICC |
|---|---|---|
| KFA | 7.46 | 0.9161 |
| MK | 16.02 | 0.8312 |
| AK | 12.89 | 0.9228 |
| RK | 19.24 | 0.8423 |
GFA showed a clear increase in reliability with angular resolution. CoV values remained low even with only 30 gradient directions.
| Metric | DTI | HARDI-60 | HARDI-90 | |||
|---|---|---|---|---|---|---|
| CoV % | ICC | CoV % | ICC | CoV % | ICC | |
| GFA | 6.37 | 0.6920 | 4.07 | 0.8122 | 4.16 | 0.8445 |
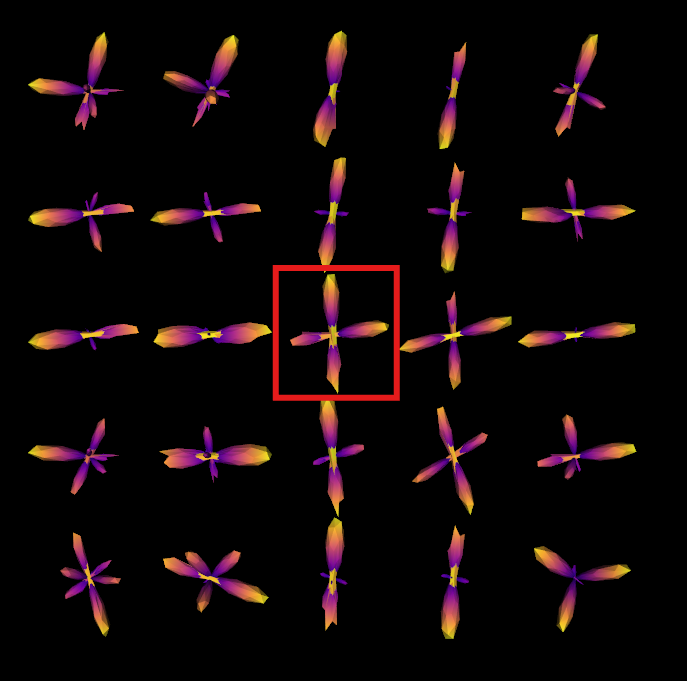
Results: CSD Crossing Angles
The ability of CSD to resolve multiple fibre orientations varied with angular separation. At 30°, CSD failed to resolve discrete fibre directions, instead producing single-peak fODFs.
| Method | 90° | 45° | 30° | |||
|---|---|---|---|---|---|---|
| Avg | RMSE | Avg | RMSE | Avg | RMSE | |
| T1w reference | 89.59° | 0.47 | 47.26° | 1.76 | 29.72° | 1.40 |
| CSD Crossing Angle | 87.10° | 3.49 | 50.07° | 8.92 | — | — |
| CSD Approach Angle | 89.39° | 4.08 | 43.29° | 3.61 | 27.67° | 3.63 |
Discussion & Conclusions
Results demonstrate that the PreOperative Performance phantom is a reliable and effective tool for evaluating the repeatability of advanced diffusion MRI metrics. Results align well with findings from earlier studies using anisotropic phantoms. Published literature reports CoV of 7–29% for FA and 2–6% for MD. Future work should extend to assess inter-scanner and inter-vendor variability, or evaluate multiple PreOperative Performance phantoms with different internal configurations.
Key Learnings
Importance of Acquisition Design
The number of diffusion gradient directions significantly impacted model performance. For CSD-based fibre tracking, high angular resolution sampling (60-90 directions) was essential for reliable results. However, standard DTI metrics remained stable even with basic 30-direction protocols, suggesting clinical scans can be optimized based on the analysis goals.
Physical Phantoms for MRI Validation
This work demonstrated that anisotropic phantoms with controlled fibre geometries can effectively validate diffusion MRI measurements. Unlike human subjects, phantoms eliminate biological variability, allowing pure assessment of measurement repeatability. The phantom successfully mimicked key features of brain white matter, including crossing fibres and branching structures.
Open-Source Tools Enable Reproducible Research
The entire analysis pipeline was built using open-source tools (DIPY, FSL, Python scientific libraries), ensuring transparency and reproducibility. All preprocessing, model fitting, and statistical analysis code was documented and version-controlled, supporting the growing movement toward open science in neuroimaging research.
Photo Gallery
Results visualization and fibre orientation distributions • Click to view all 6 images
Documentation
Supervisor: Dr. Michael D. Noseworthy
Collaborators: PreOperative Performance Inc. (Toronto, ON)
Imaging Facility: Imaging Research Centre, St. Joseph’s Healthcare Hamilton
| Program: Master of Applied Science (MASc) | McMaster University | May 2024 - May 2025 |