
The Problem
Different physiological signals, such as muscle activity or brain waves, vary dramatically in amplitude and frequency. These signals are also contaminated by powerline noise, motion artifacts, and electrode interference. Designing amplifiers that can isolate these weak biosignals from environmental noise requires precise gain staging, strategic filtering, and careful circuit optimization.
The Solution
Built custom bioinstrumentation amplifiers tailored to each signal type, ranging from 1000× gain for EMG to 40,000× for EEG. Each circuit combined differential amplification for noise rejection, bandpass filtering matched to physiological frequencies, and MATLAB-based algorithms for automated signal analysis and feature extraction.
Skills Applied
Lab 1: EMG (Electromyography)
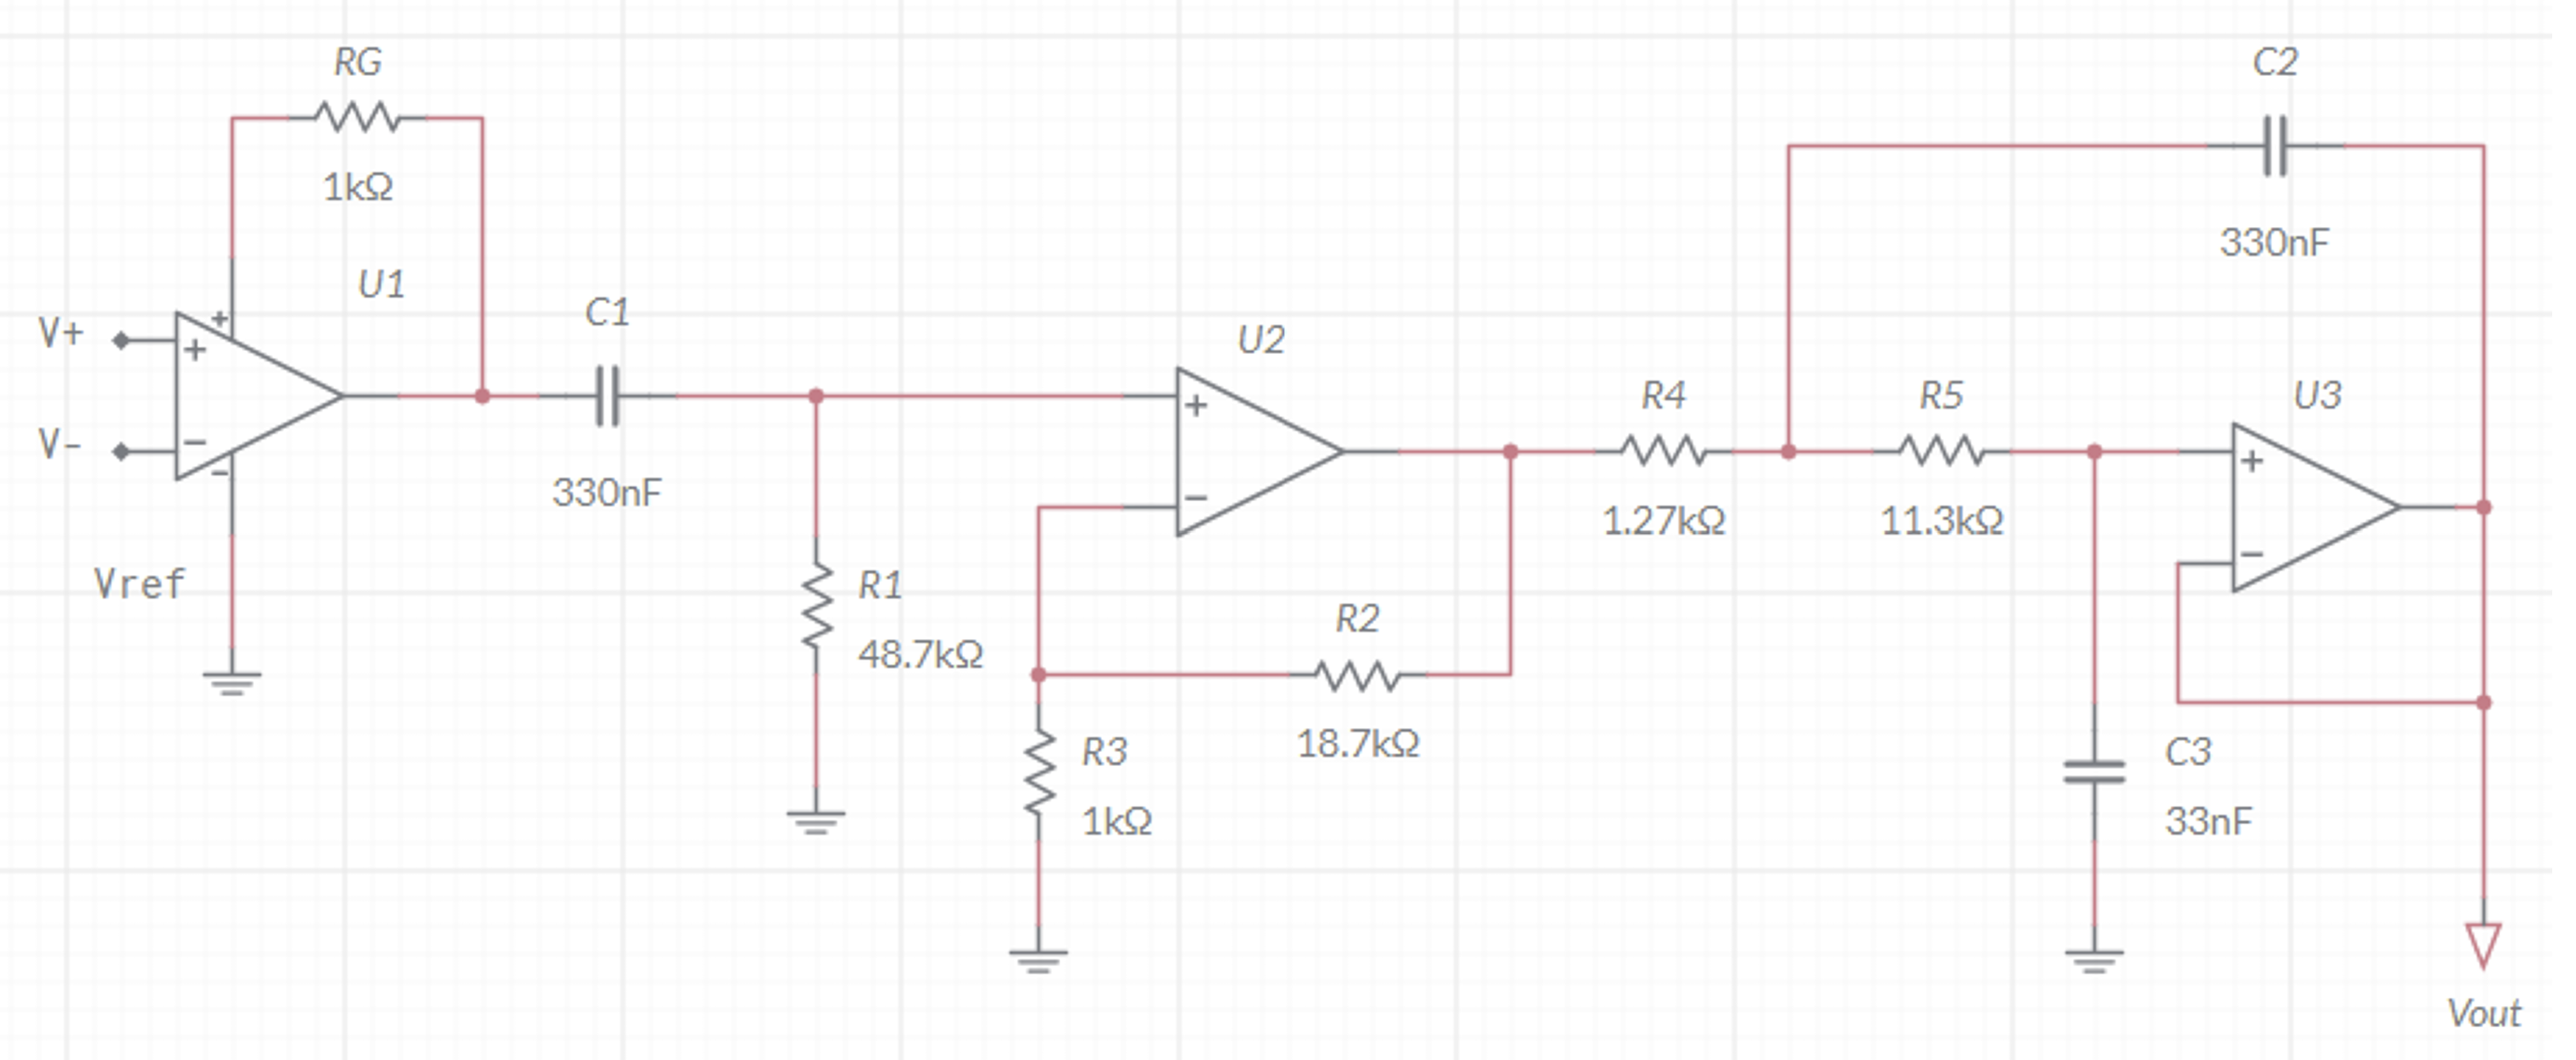
Built a three-stage differential amplifier to measure muscle electrical activity.
Circuit specifications:
- Headstage with gain of 50 and 69.20 dB CMRR for noise rejection
- 10Hz active high-pass filter with stage gain of 20
- 500Hz low-pass filter
Key Experiments:
- Compared frequency spectra of isometric vs. dynamic contractions
- Measured exponential relationship between muscle force and EMG magnitude (0-20 lbs)
- Analyzed muscle fatigue through RMS and centroid frequency shifts during 60-second isometric contraction
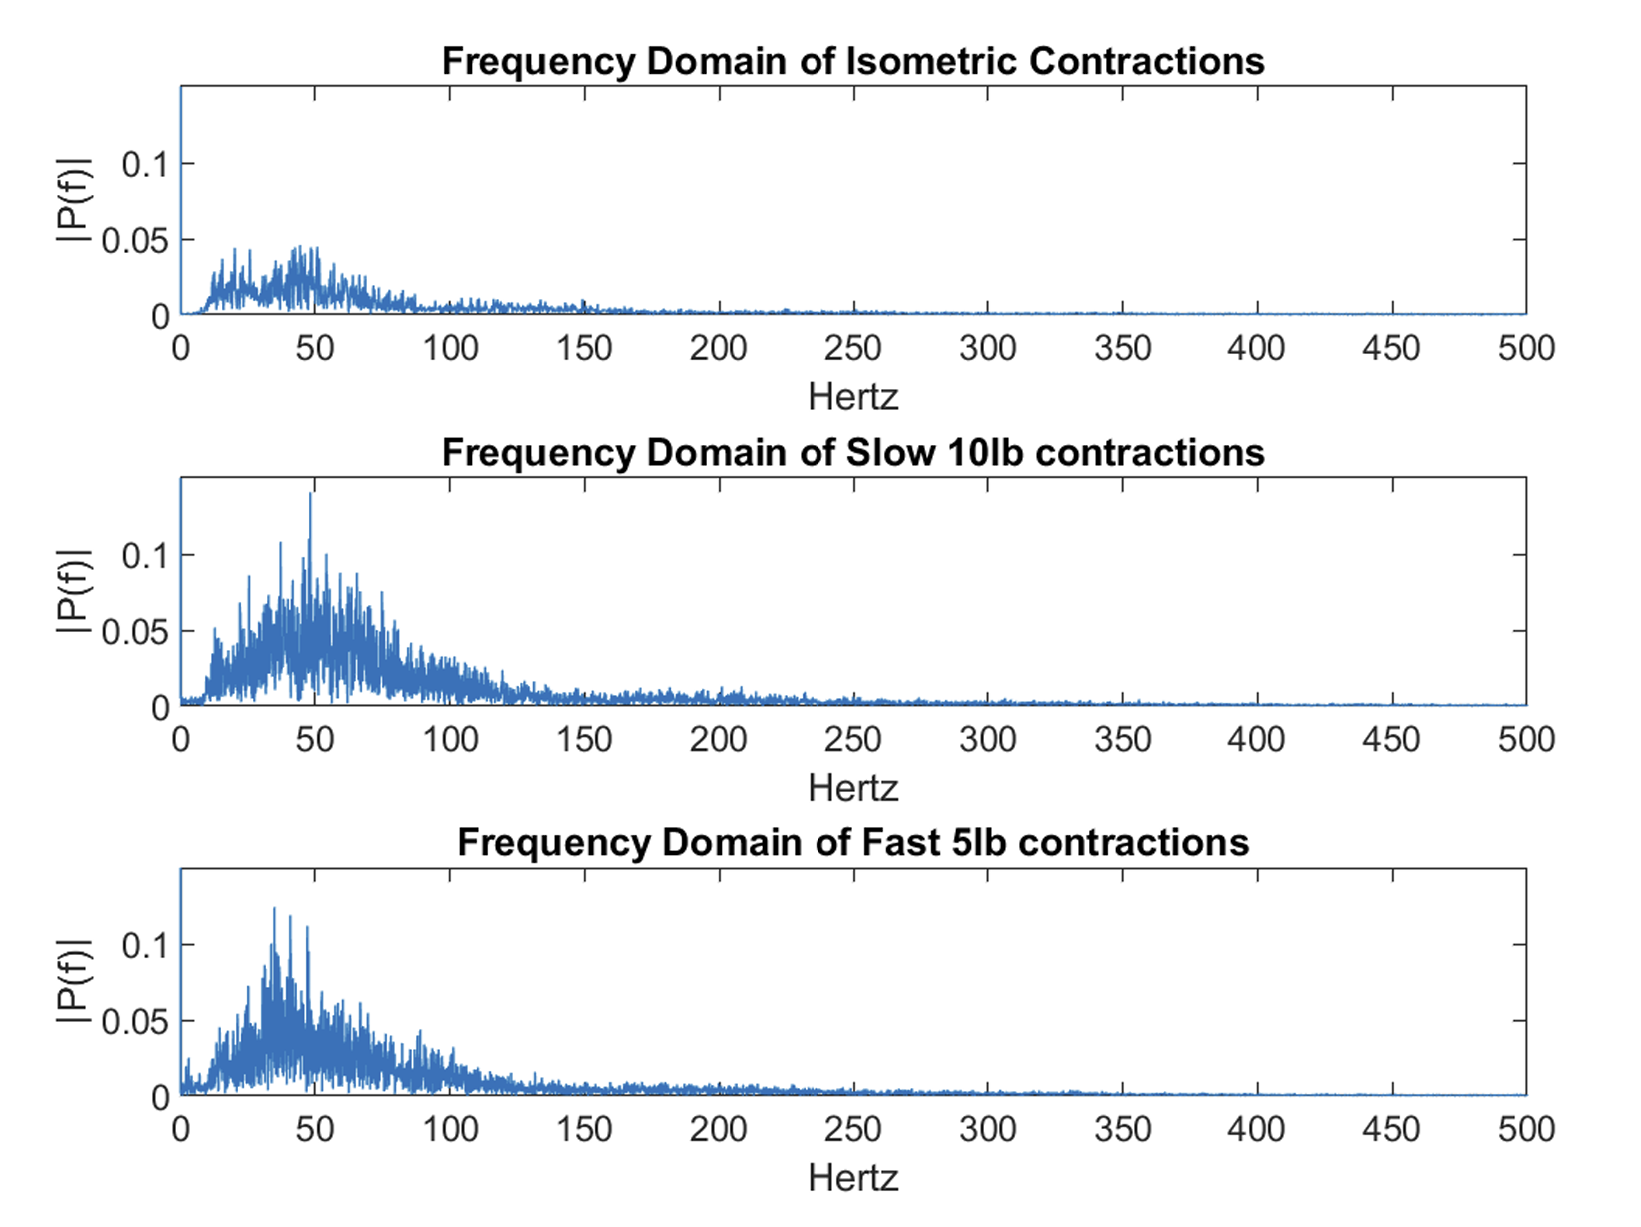
Frequency analysis showed increased EMG activity in the 10-100 Hz range across all contraction types, with slow 10 lb contractions peaking at 50 Hz, fast 5 lb contractions at 40 Hz, and isometric contractions showing no distinct peak.
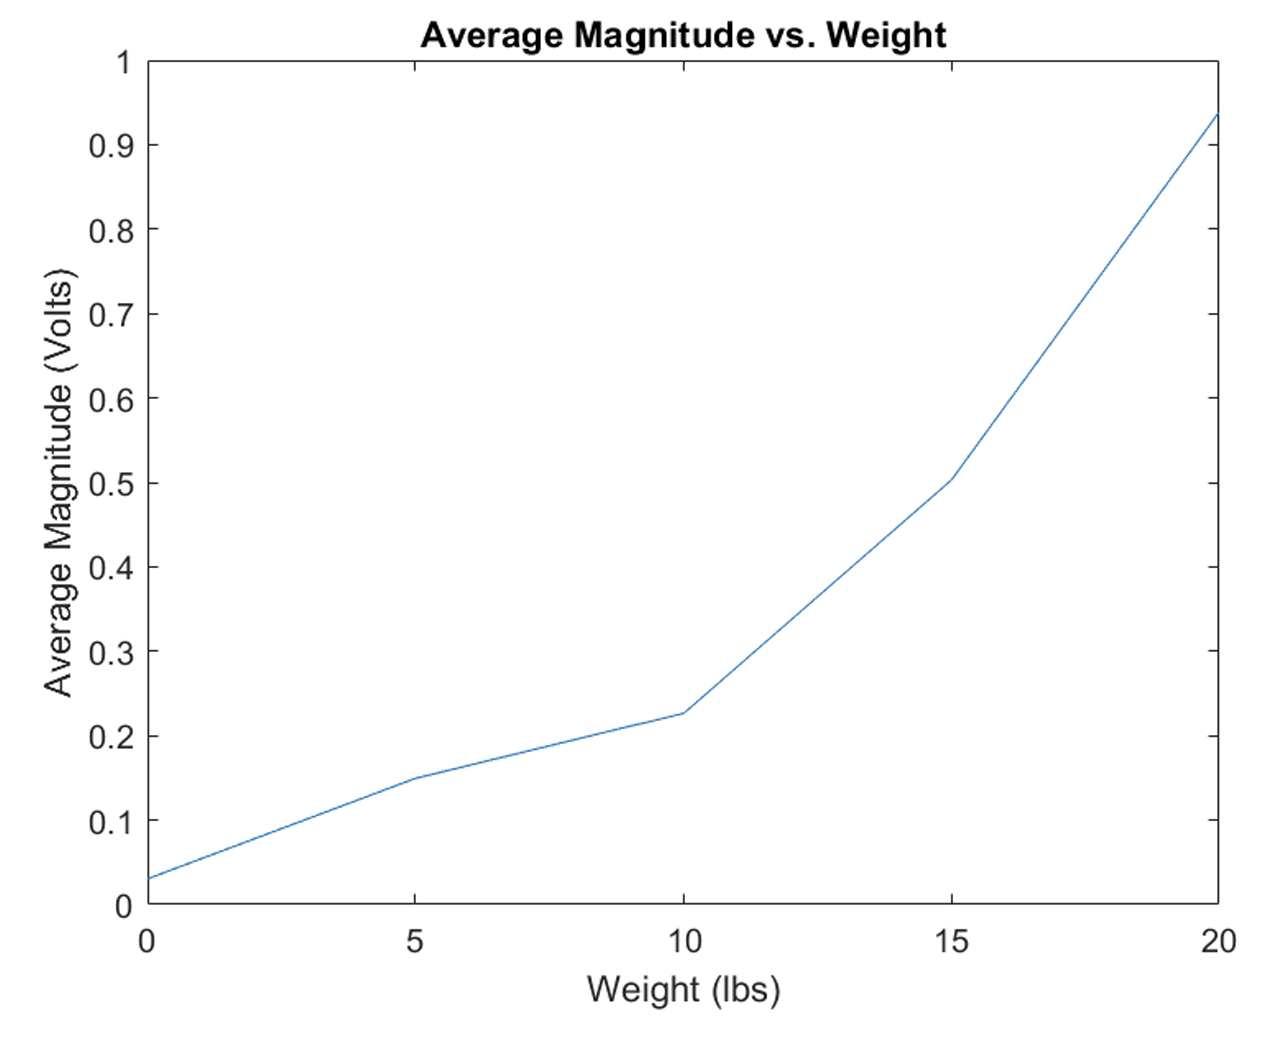
The average magnitude vs. weight graph shows a positive relationship, which is expected. As the muscle tries to support more weight, there will be more electrical activity within the muscle.
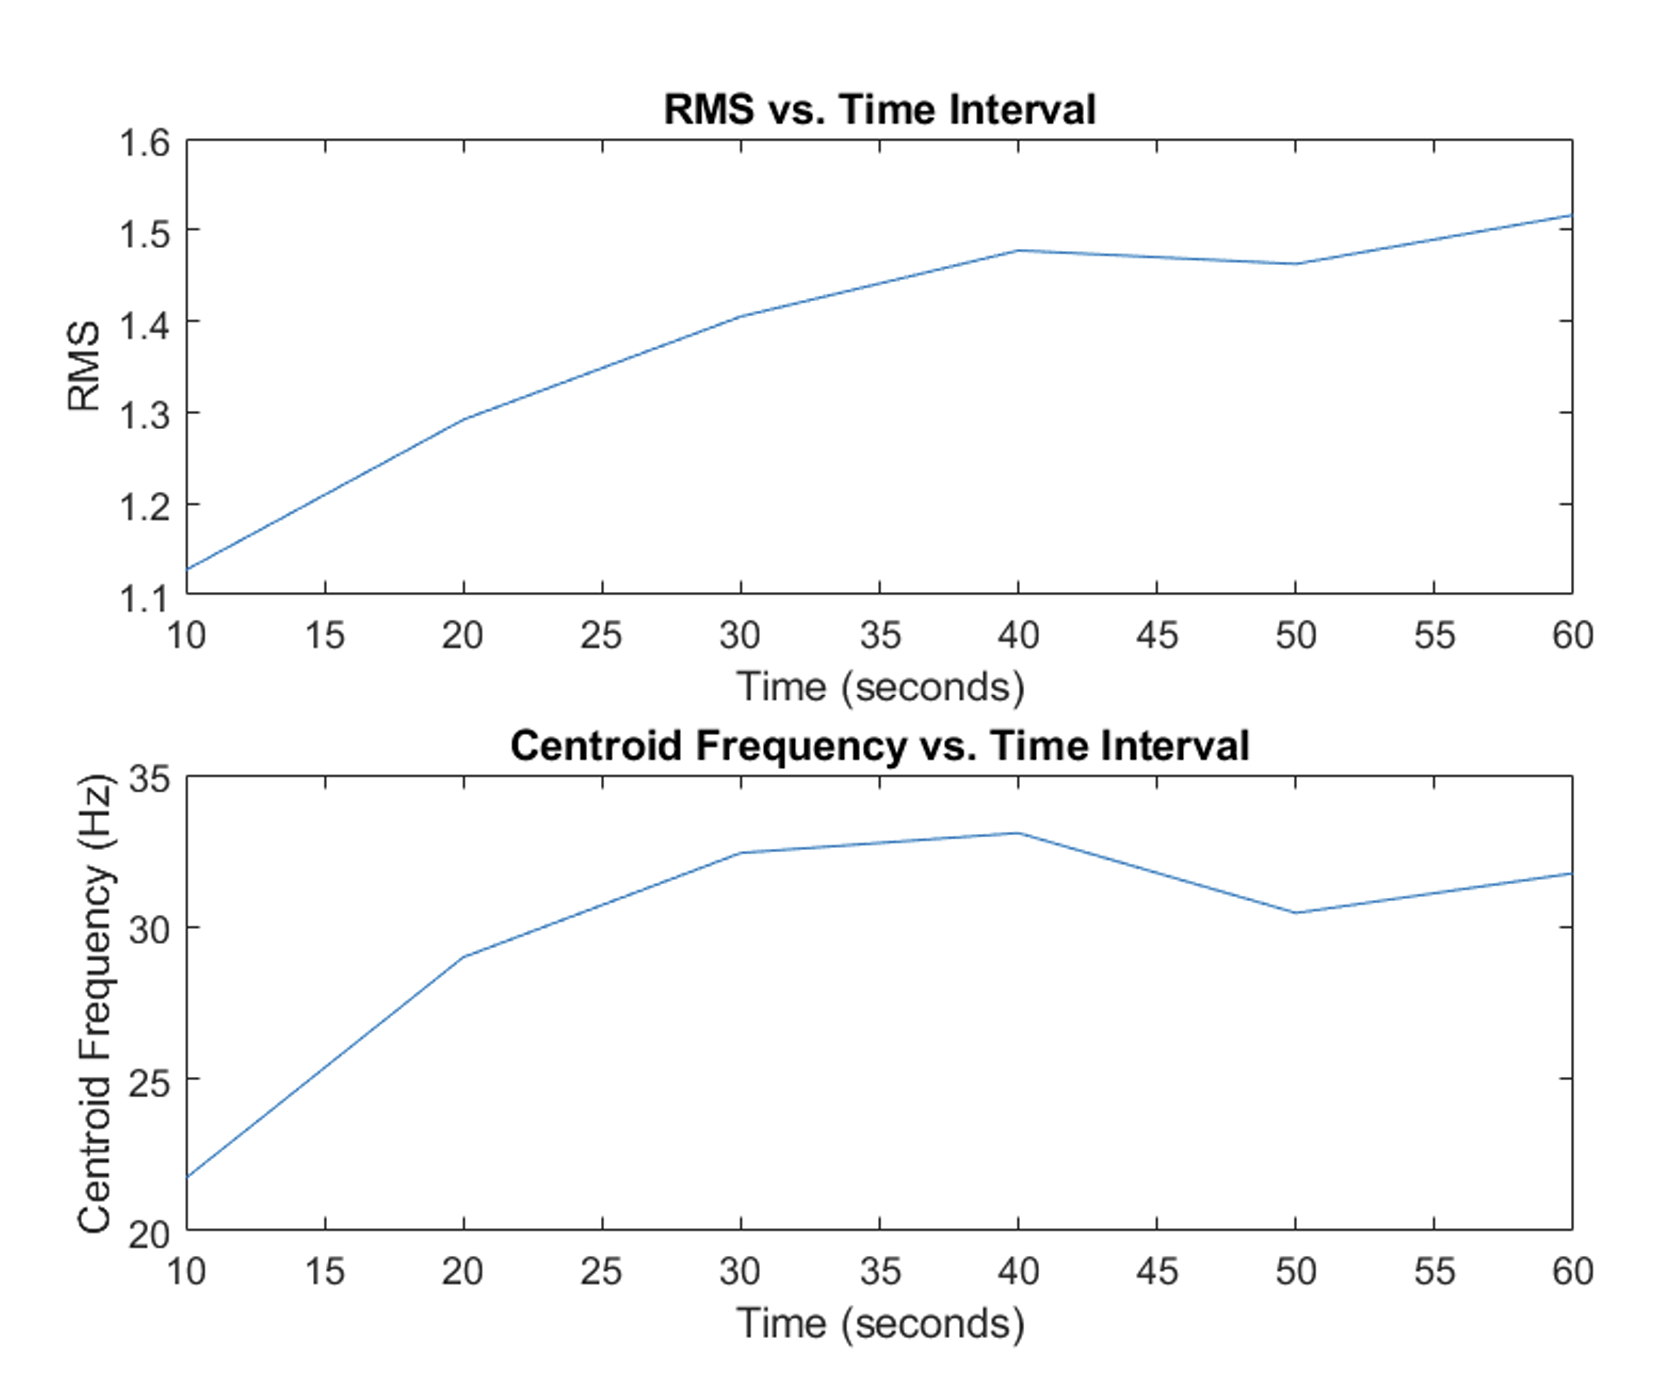
Both RMS and centroid frequency increased during the first 40 seconds of sustained contraction before plateauing, indicating progressive muscle fatigue as more motor units were recruited to maintain constant force.
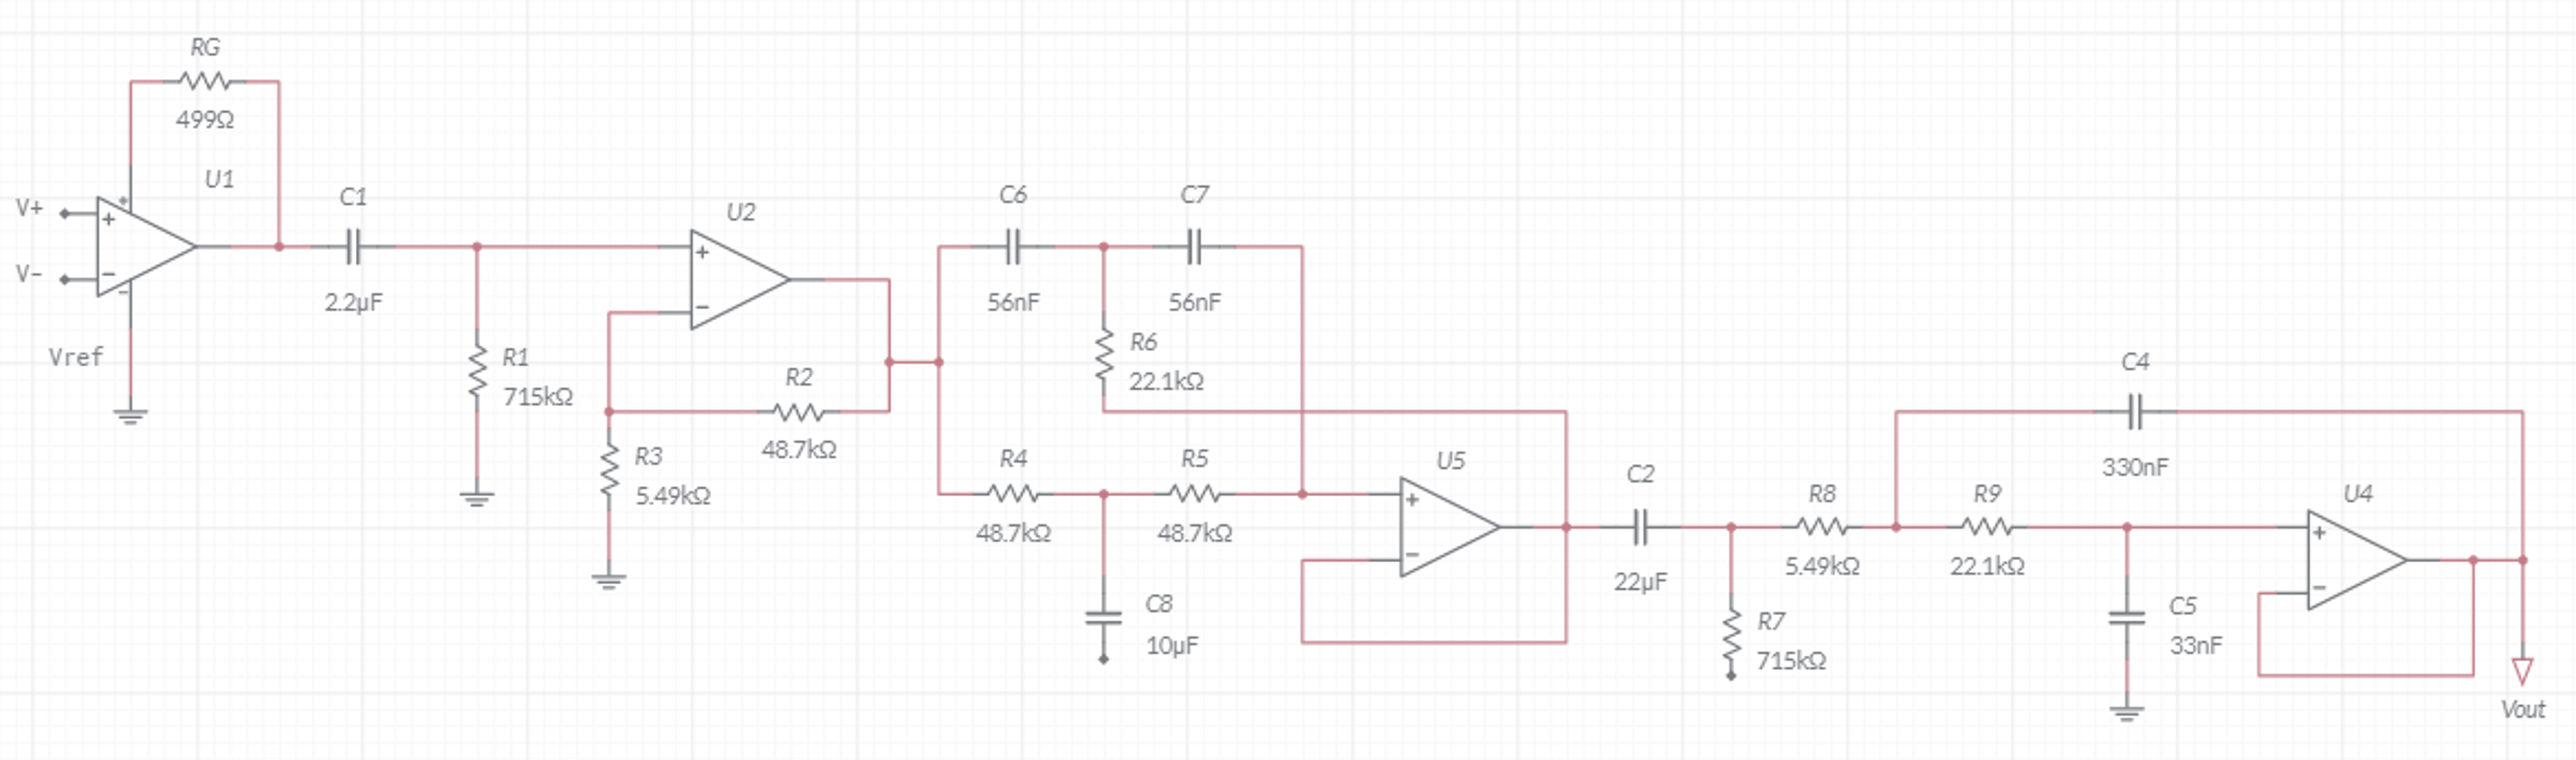
Lab 2: ECG (Electrocardiography)
Designed cardiac amplifier with 60 Hz notch filter and developed automated heart rate detection algorithm.
Circuit specifications:
- Differential amplification with total gain of 1000
- Bandpass filtering: 0.1-200 Hz (isolates cardiac frequencies)
- 60 Hz notch filter for powerline noise rejection
Key Experiments:
- Recorded ECG signals at varying heart rates (60, 80, 120 BPM) using patient simulator
- Implemented a digital 6th order bandpass filter (10-25 Hz) for noise reduction, simplifying peak detection
- Developed MATLAB algorithm using
findpeaksfunction to automatically calculate heart rate from ECG data
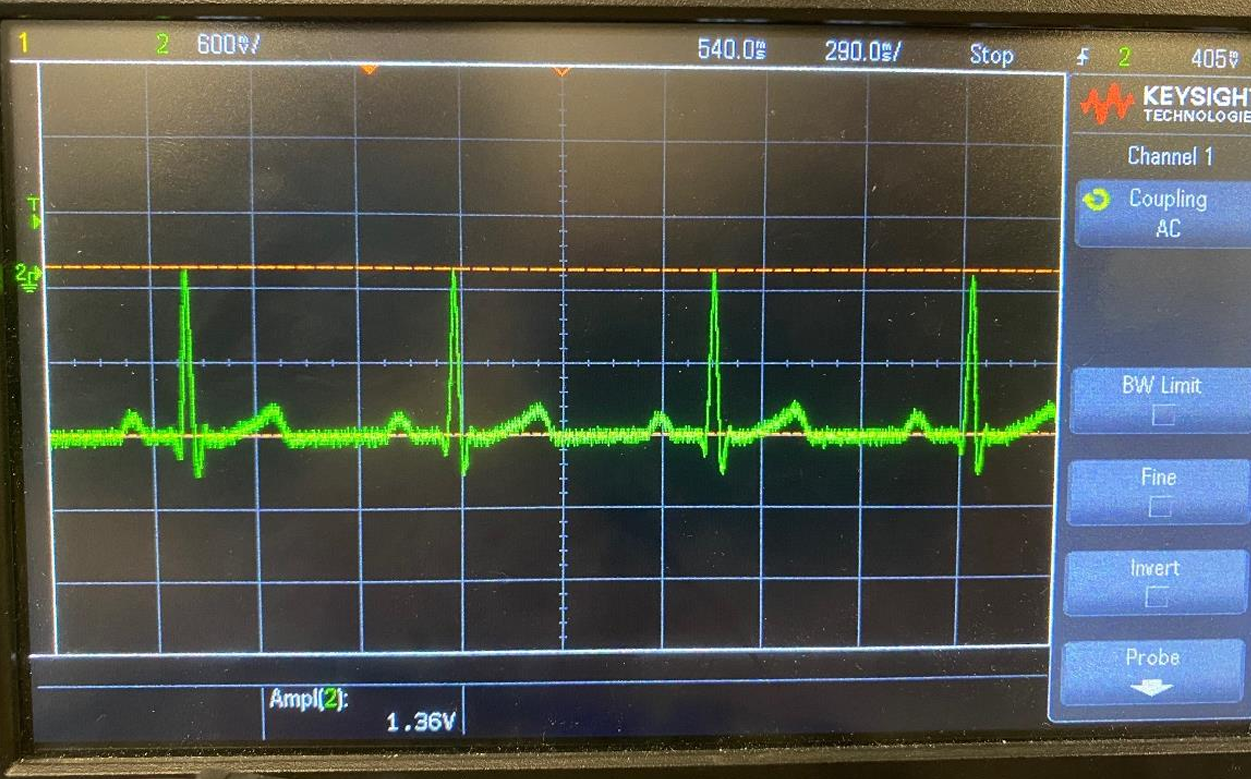
Oscilloscope response for the patient simulator of an 80 BPM heart rate (normal sinus rhythm).
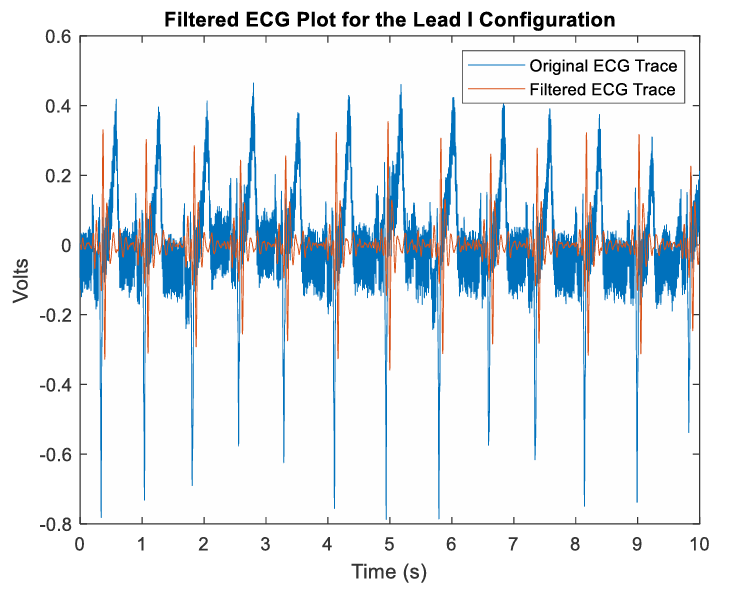
Output graph of signal after filtering with a 6th order bandpass filter using MATLAB's fdesign.bandpass function. The ECG traces are much more visible, with less noise impacting the signal.
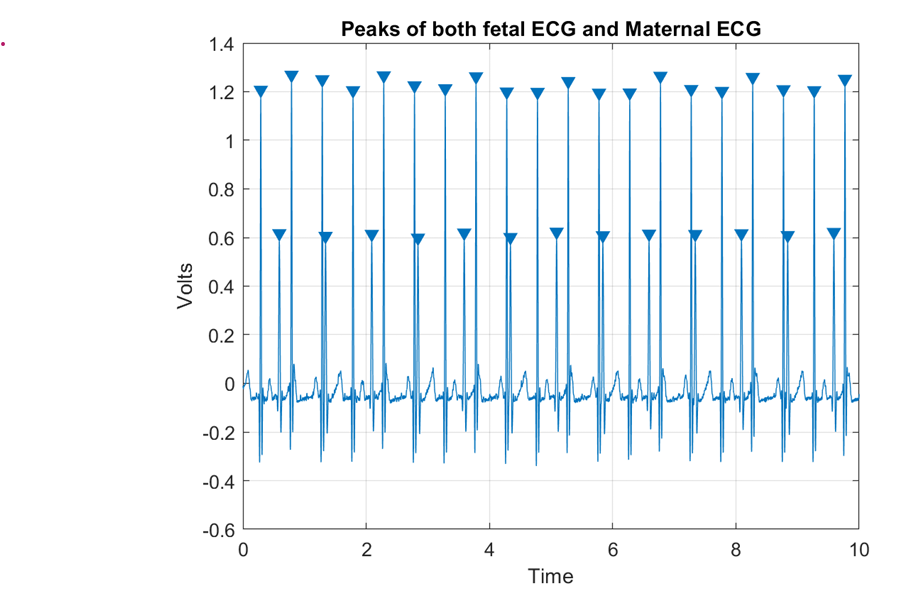
Simulated patient ECG of a pregnant person with both fetal and maternal signal. MATLAB's findpeaks function was used to find the number of local maxima and calculate fetal heart rate (120bpm) and maternal heart rate (78bpm).
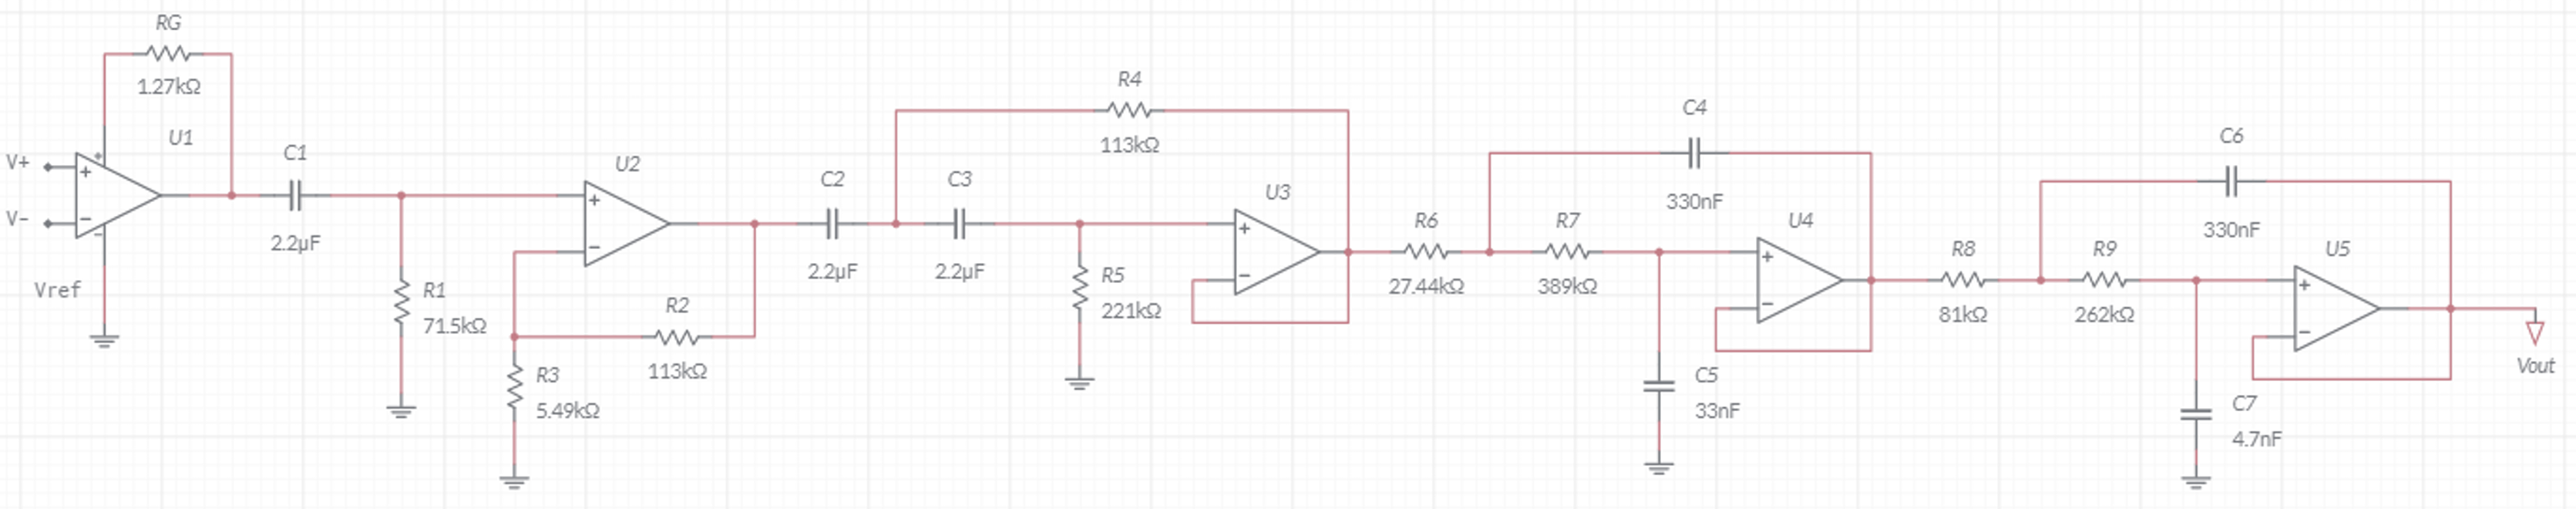
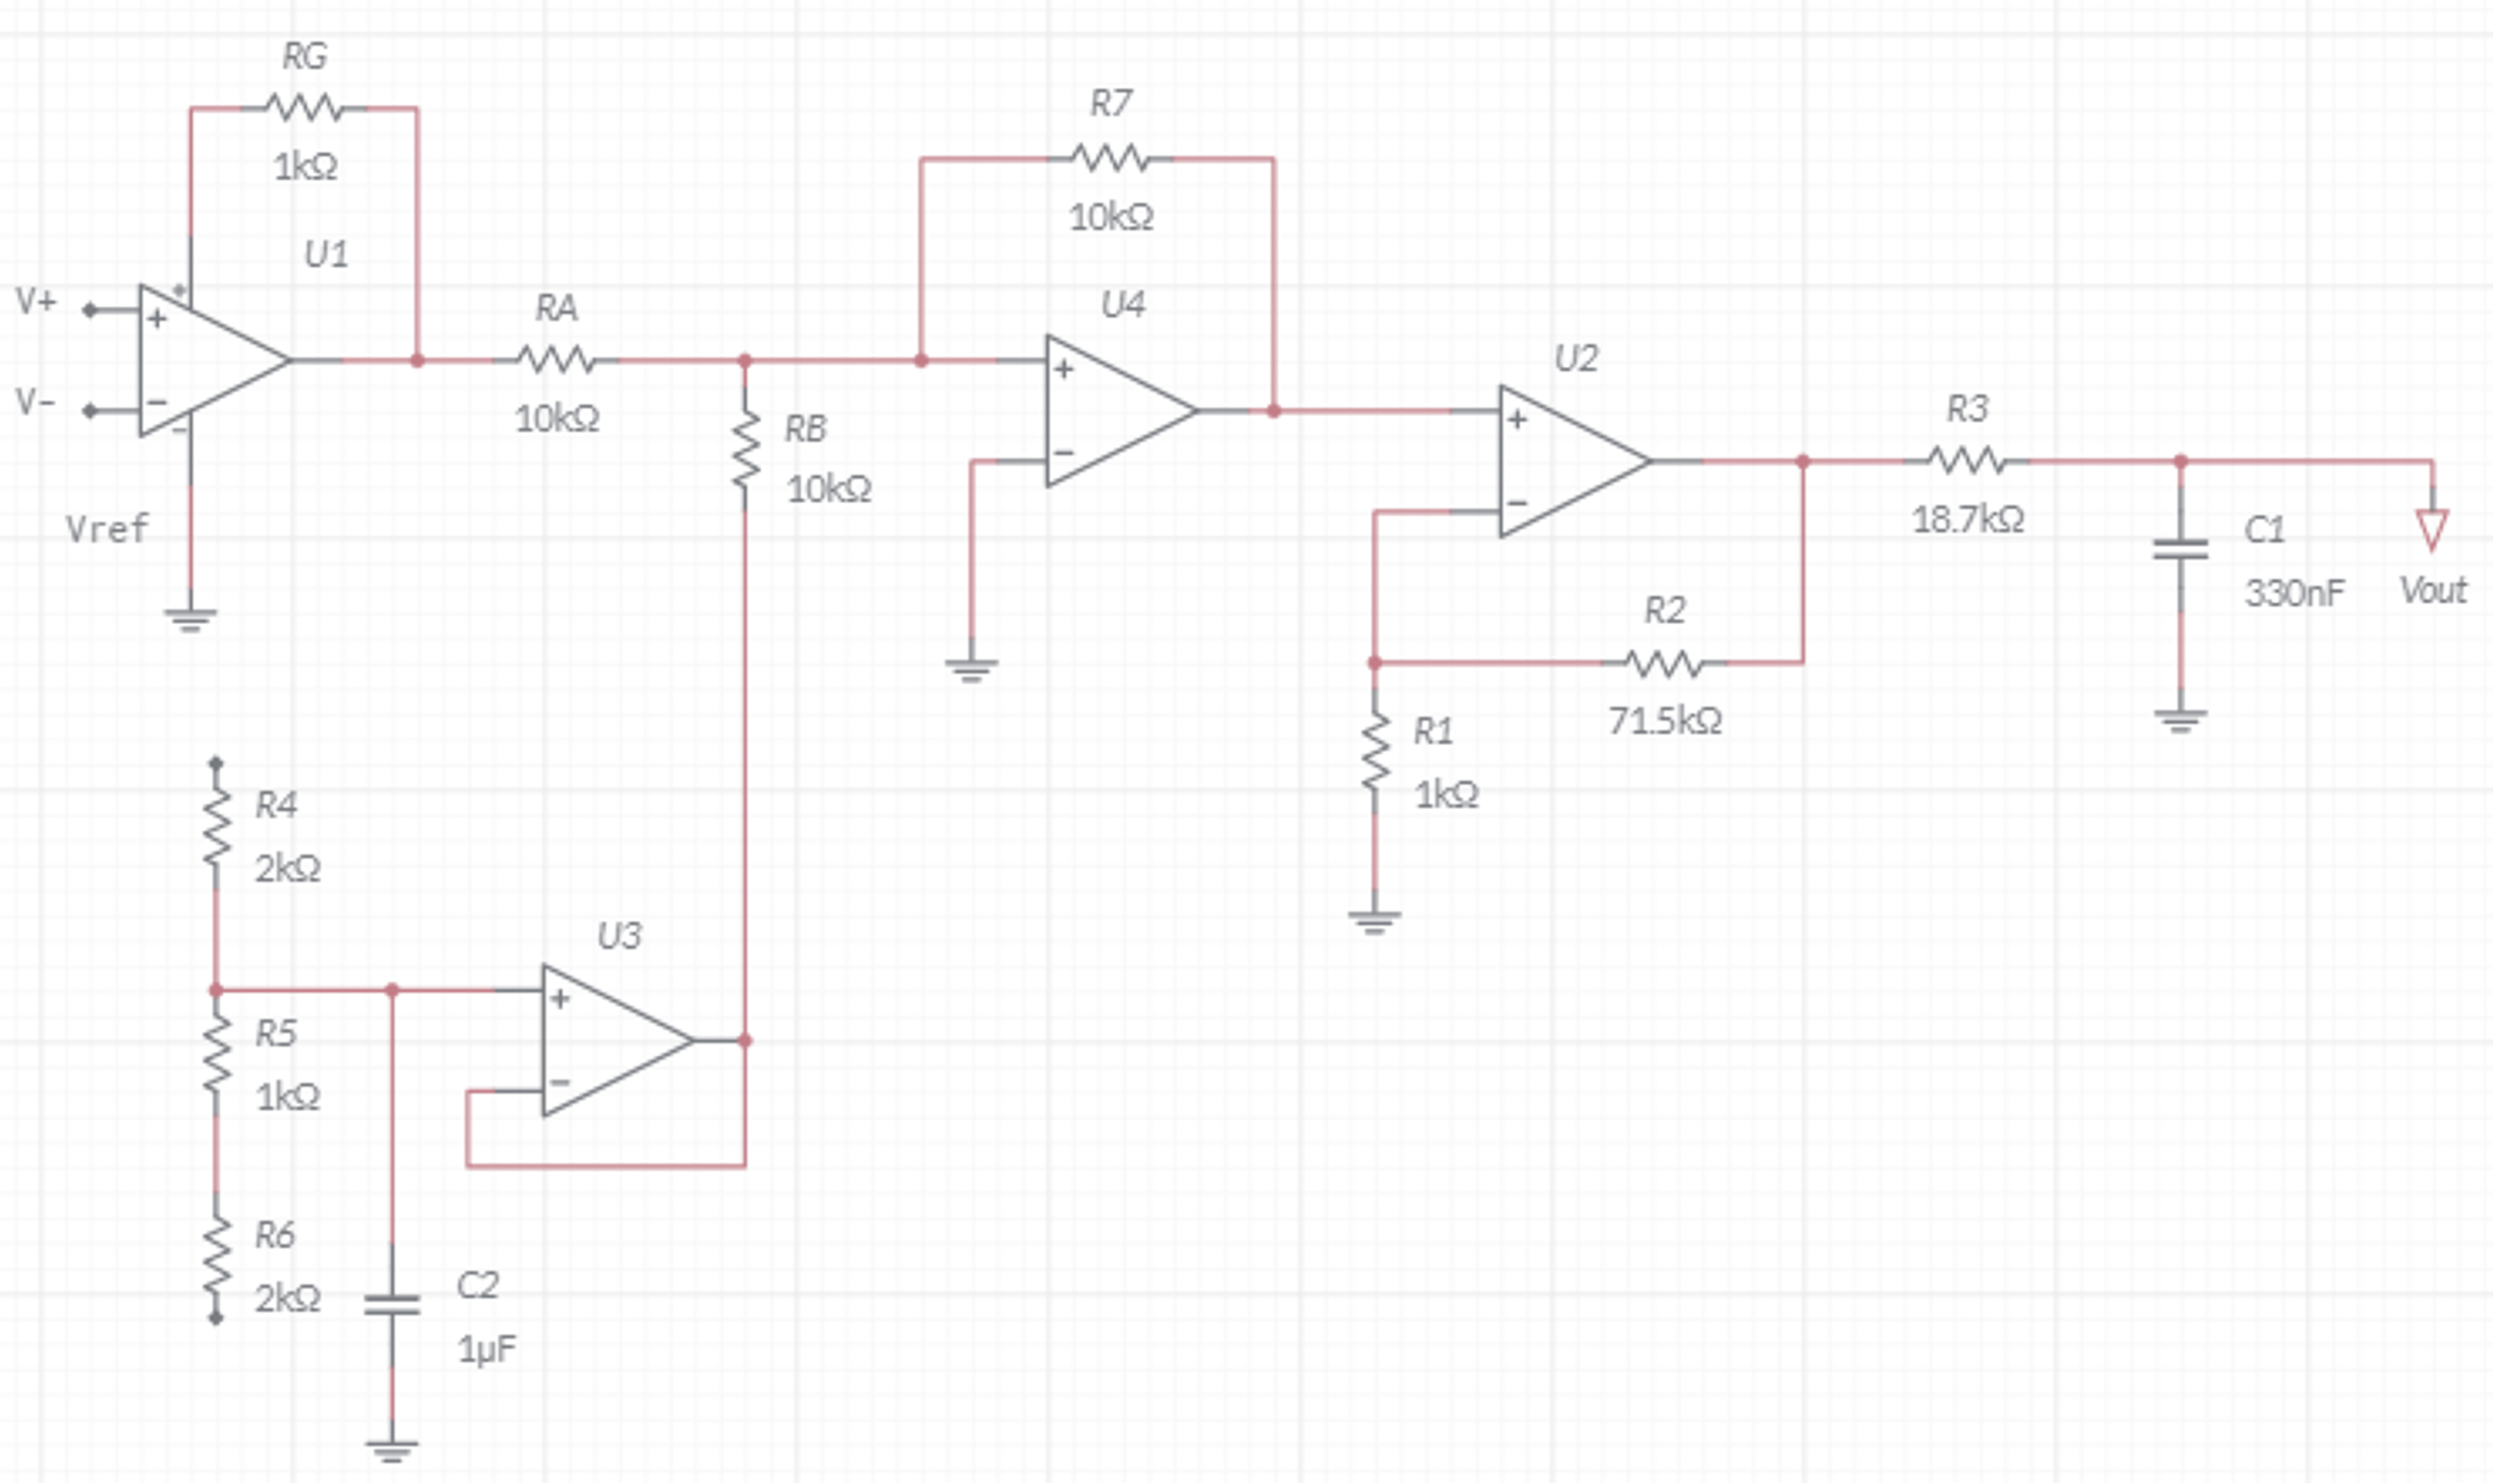
Lab 3: EEG (Electroencephalography)
Designed ultra-high gain amplifier to measure brain electrical activity and analyzed cognitive states through frequency domain analysis.
Circuit specifications:
- Total gain of 40,000 (40× first stage, 1000× second stage)
- Bandpass filtering: 0.1-30 Hz (isolates brain wave frequencies)
- 60 Hz notch filter for powerline noise rejection
Brain Wave Analysis:
| Wave Type | Frequency | Mental State |
|---|---|---|
| Delta | 0.5-4 Hz | Deep sleep |
| Theta | 4-8 Hz | Light sleep |
| Alpha | 8-12 Hz | Relaxed, eyes closed |
| Beta | 12-30 Hz | Alert, active thinking |
| Gamma | 30-100+ Hz | Intense focus |
Key Experiments:
- Recorded and analyzed brain wave patterns across different cognitive states (alert, relaxed, eyes open/closed)
- Separated alpha waves (8-12 Hz) and beta waves (12-30 Hz) using 30th order Butterworth bandpass filters
- Identified blink artifacts in beta frequency range through spectral analysis
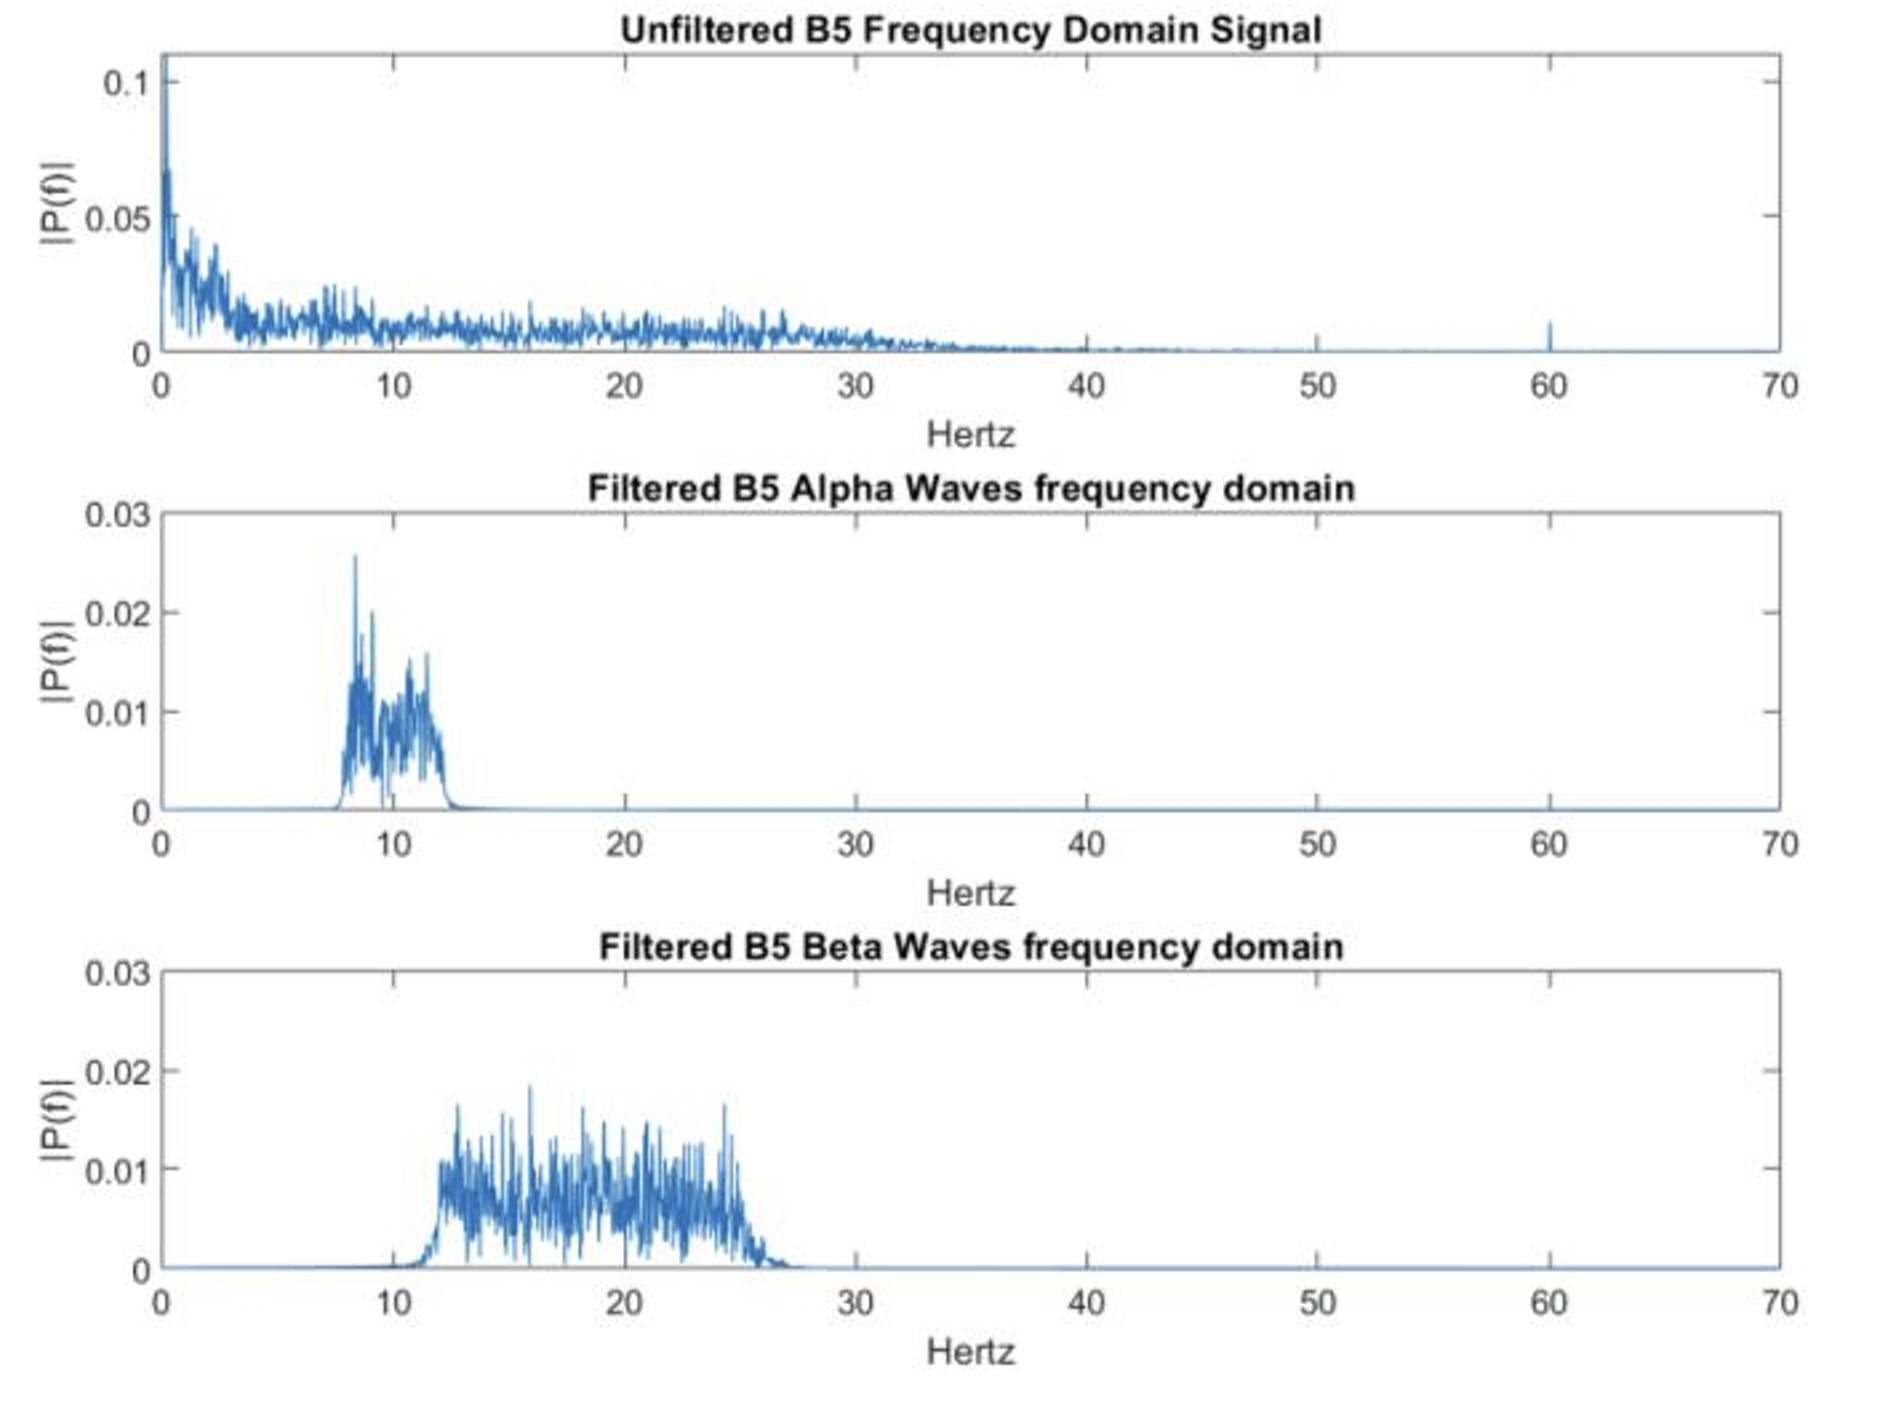
Filtered alpha and beta waves of the relaxed subject. The alpha wave slightly dominates over the beta waves (maximum ~0.025 vs. 0.020), which is consistent with the relaxed behaviour of the subject.
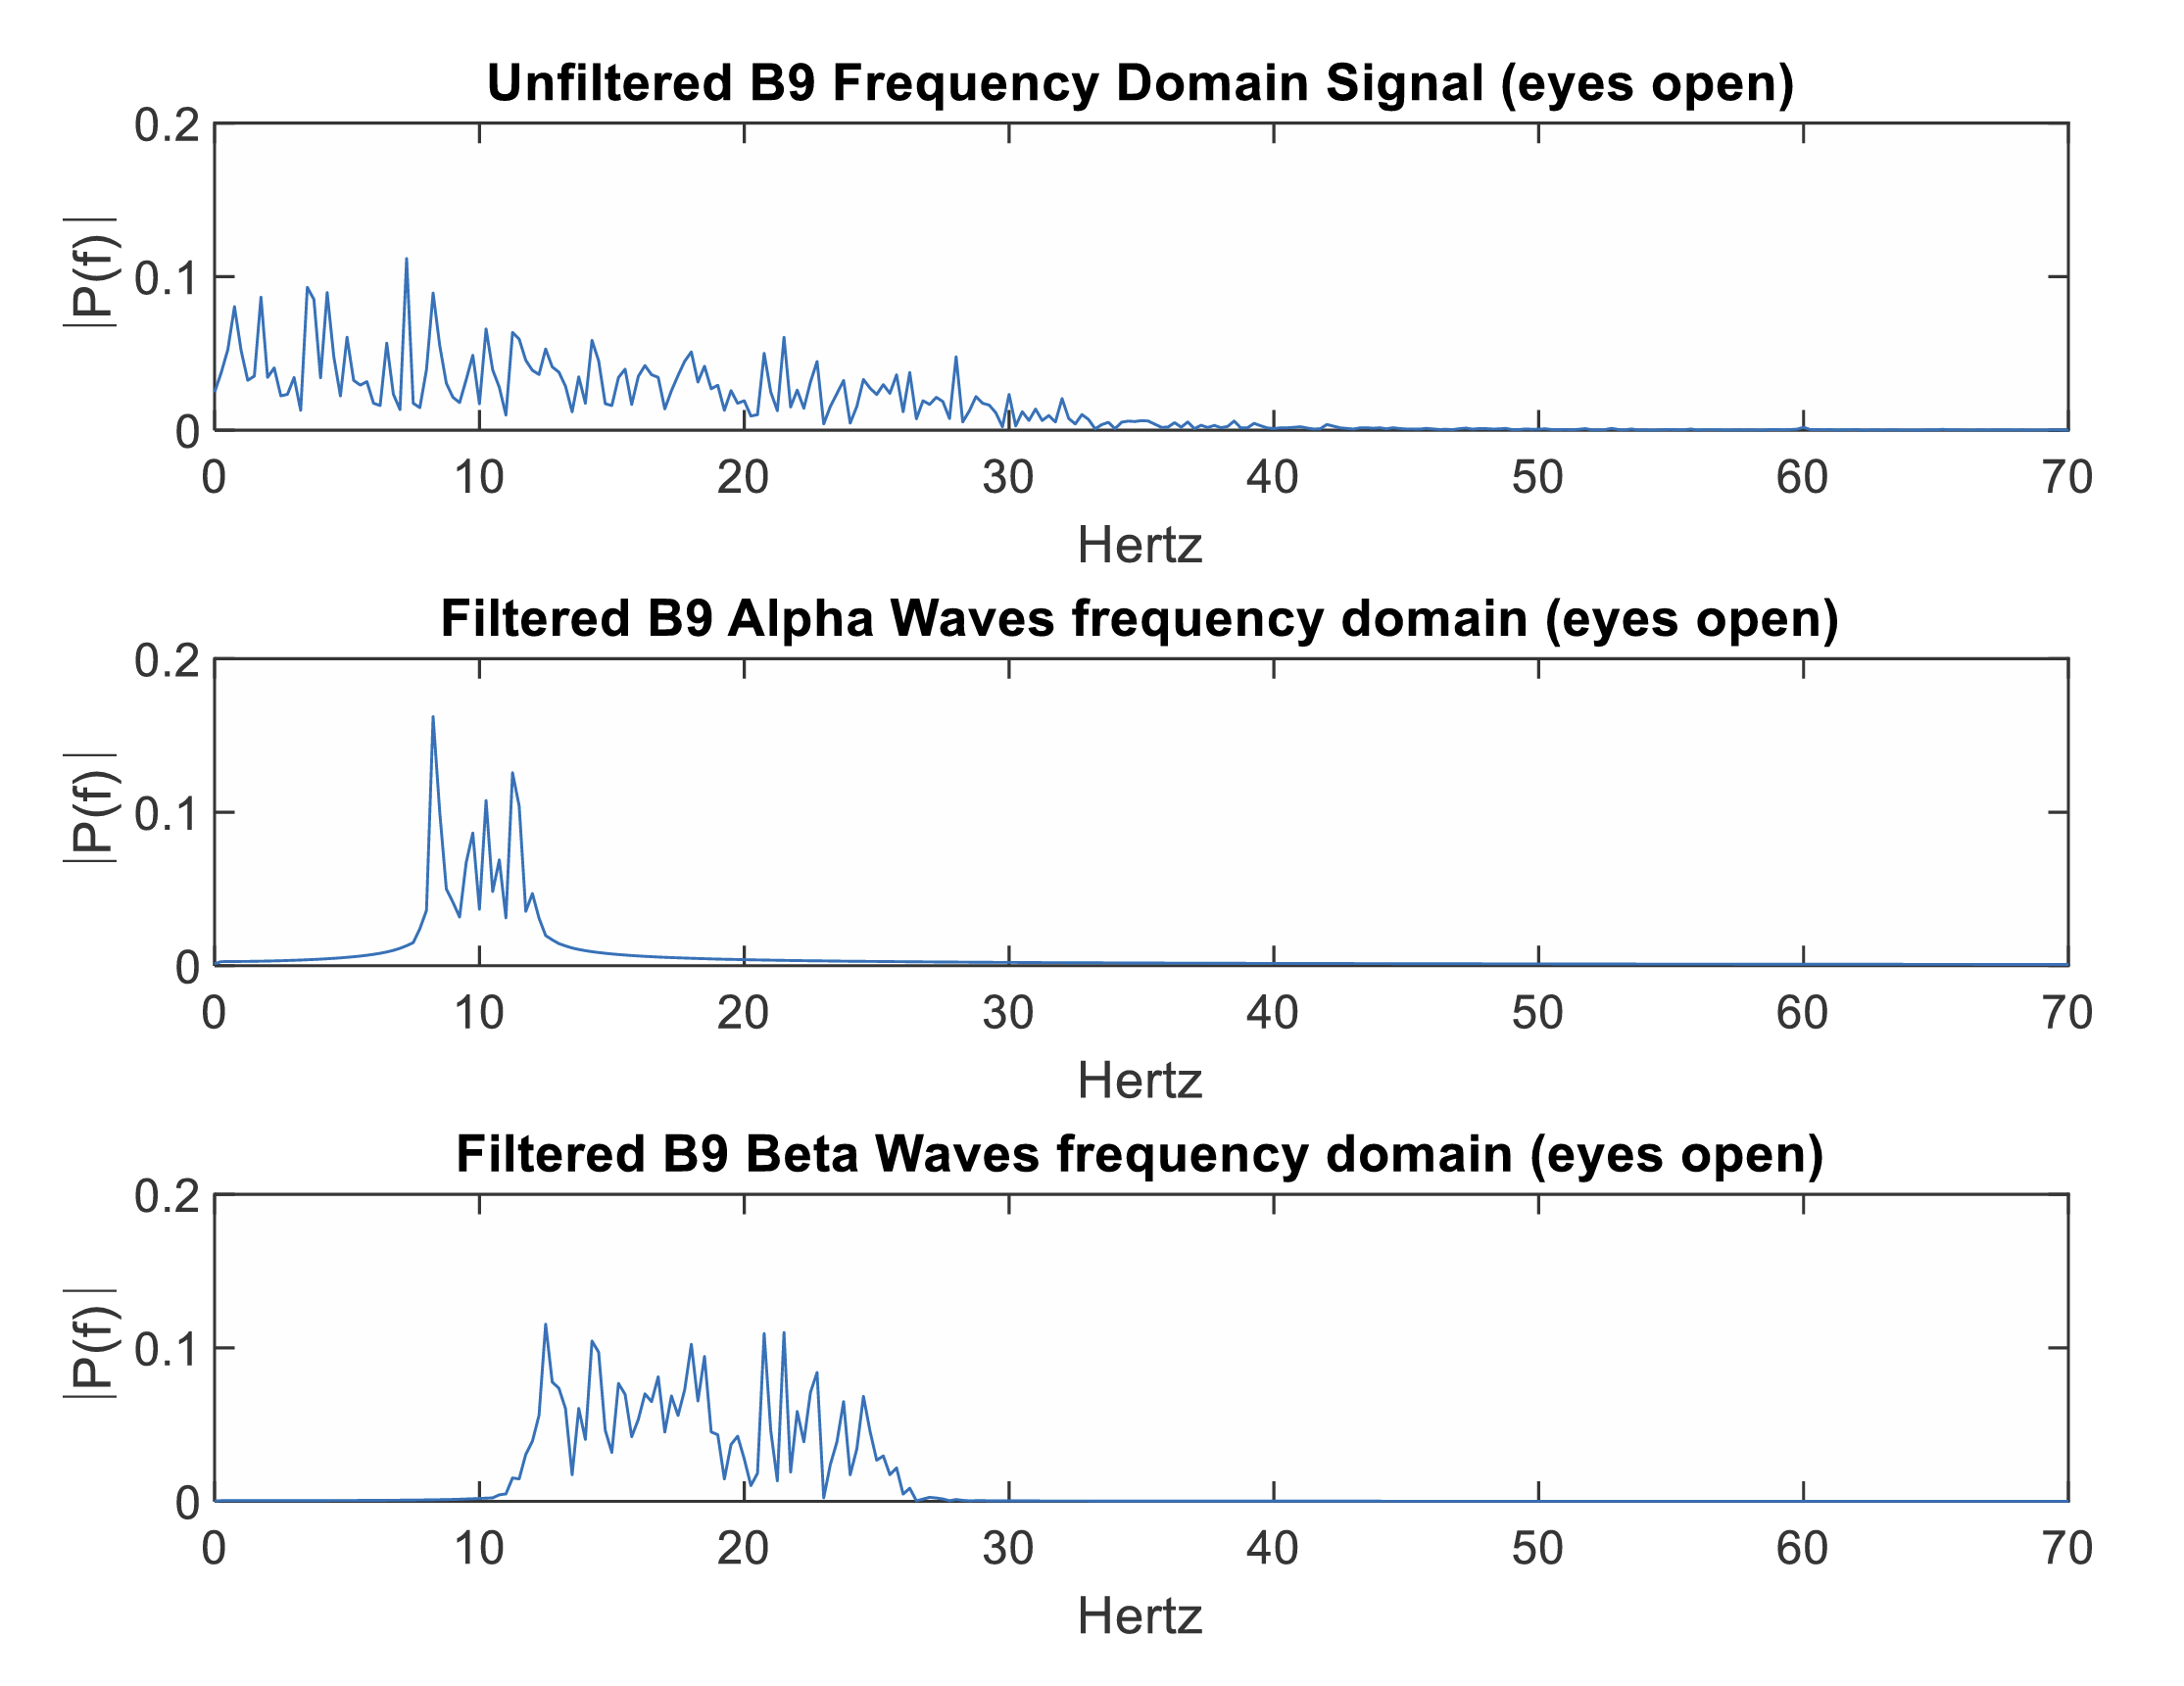
Filtered alpha and beta waves of the subject with their eyes closed. The magnitude of the frequencies associated with alpha waves is significantly higher than when eyes were closed.
Lab 4: EOG (Electrooculography)
Designed amplifier to measure eye movement through corneal-retinal potential differences and implemented eye-tracking interface.
Circuit specifications:
- Headstage with differential amplification followed by level shifter for offset correction
- Inverting summing amplifier makes total gain of 3500 across two amplification stages
- Passive low-pass filter with 25 Hz cutoff
Key Experiments:
- Established linear relationship between gaze angle and voltage output (-30° to +30°) with R² = 0.984
- Analyzed signal drift and calibration challenges in EOG measurements
- Developed eye-tracking mouse control system using EOG signals with blink detection for clicking
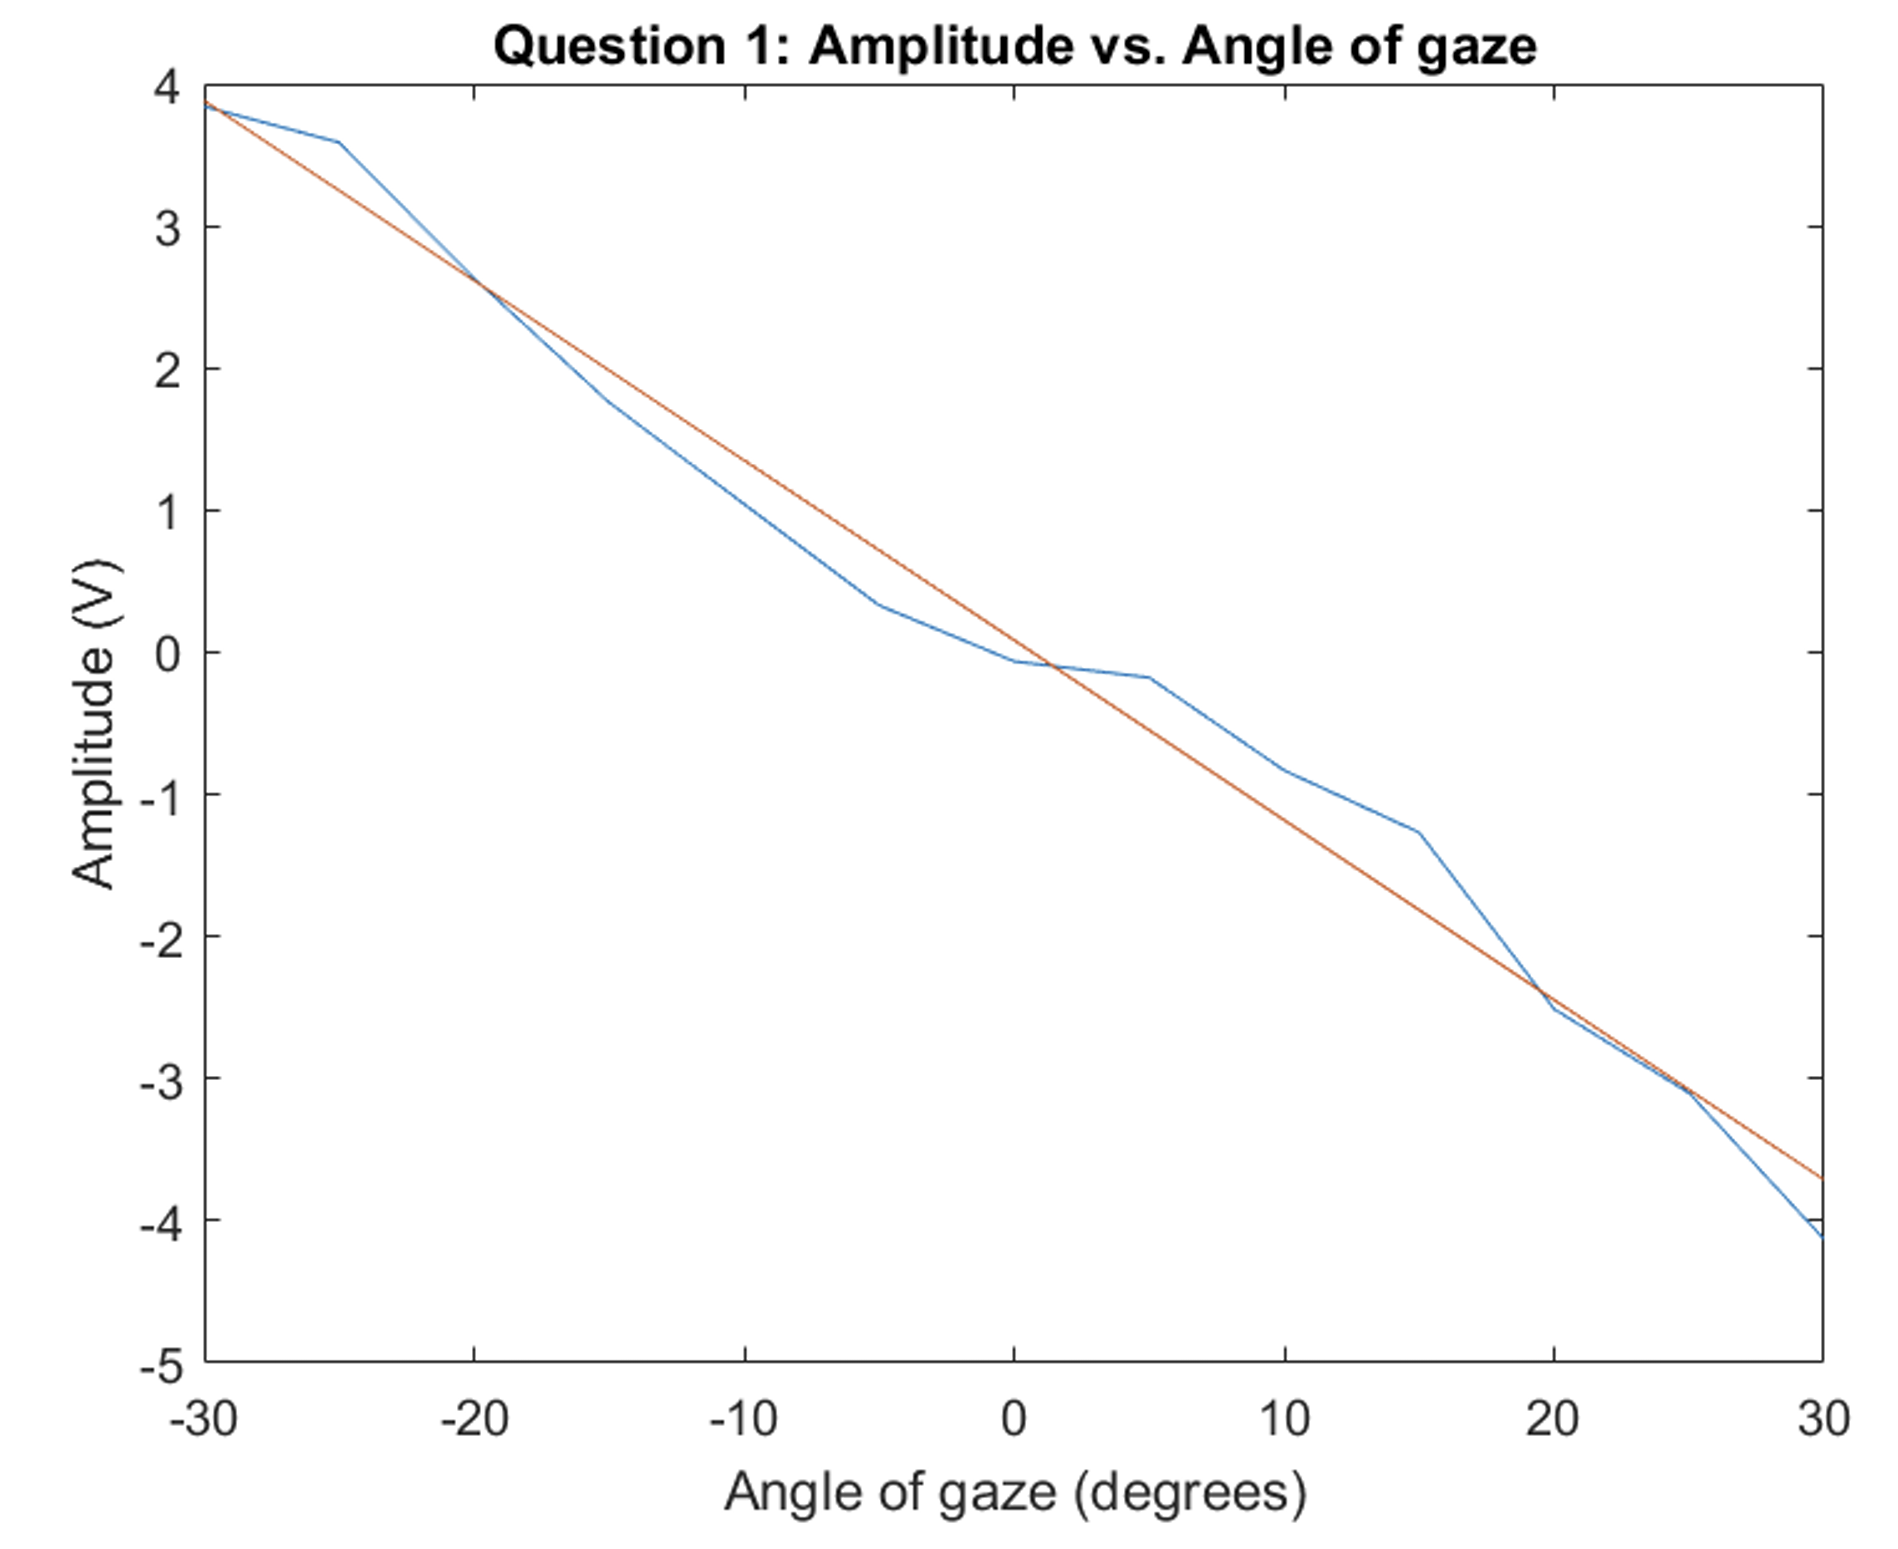
Amplitude response as a function of gaze angle (blue) and linear regression model (red). Linear regression was model equation is V = -0.12656θ + 0.085 (R² = 0.984), where V is the amplitude in volts and 𝜃 is the angle in degrees.
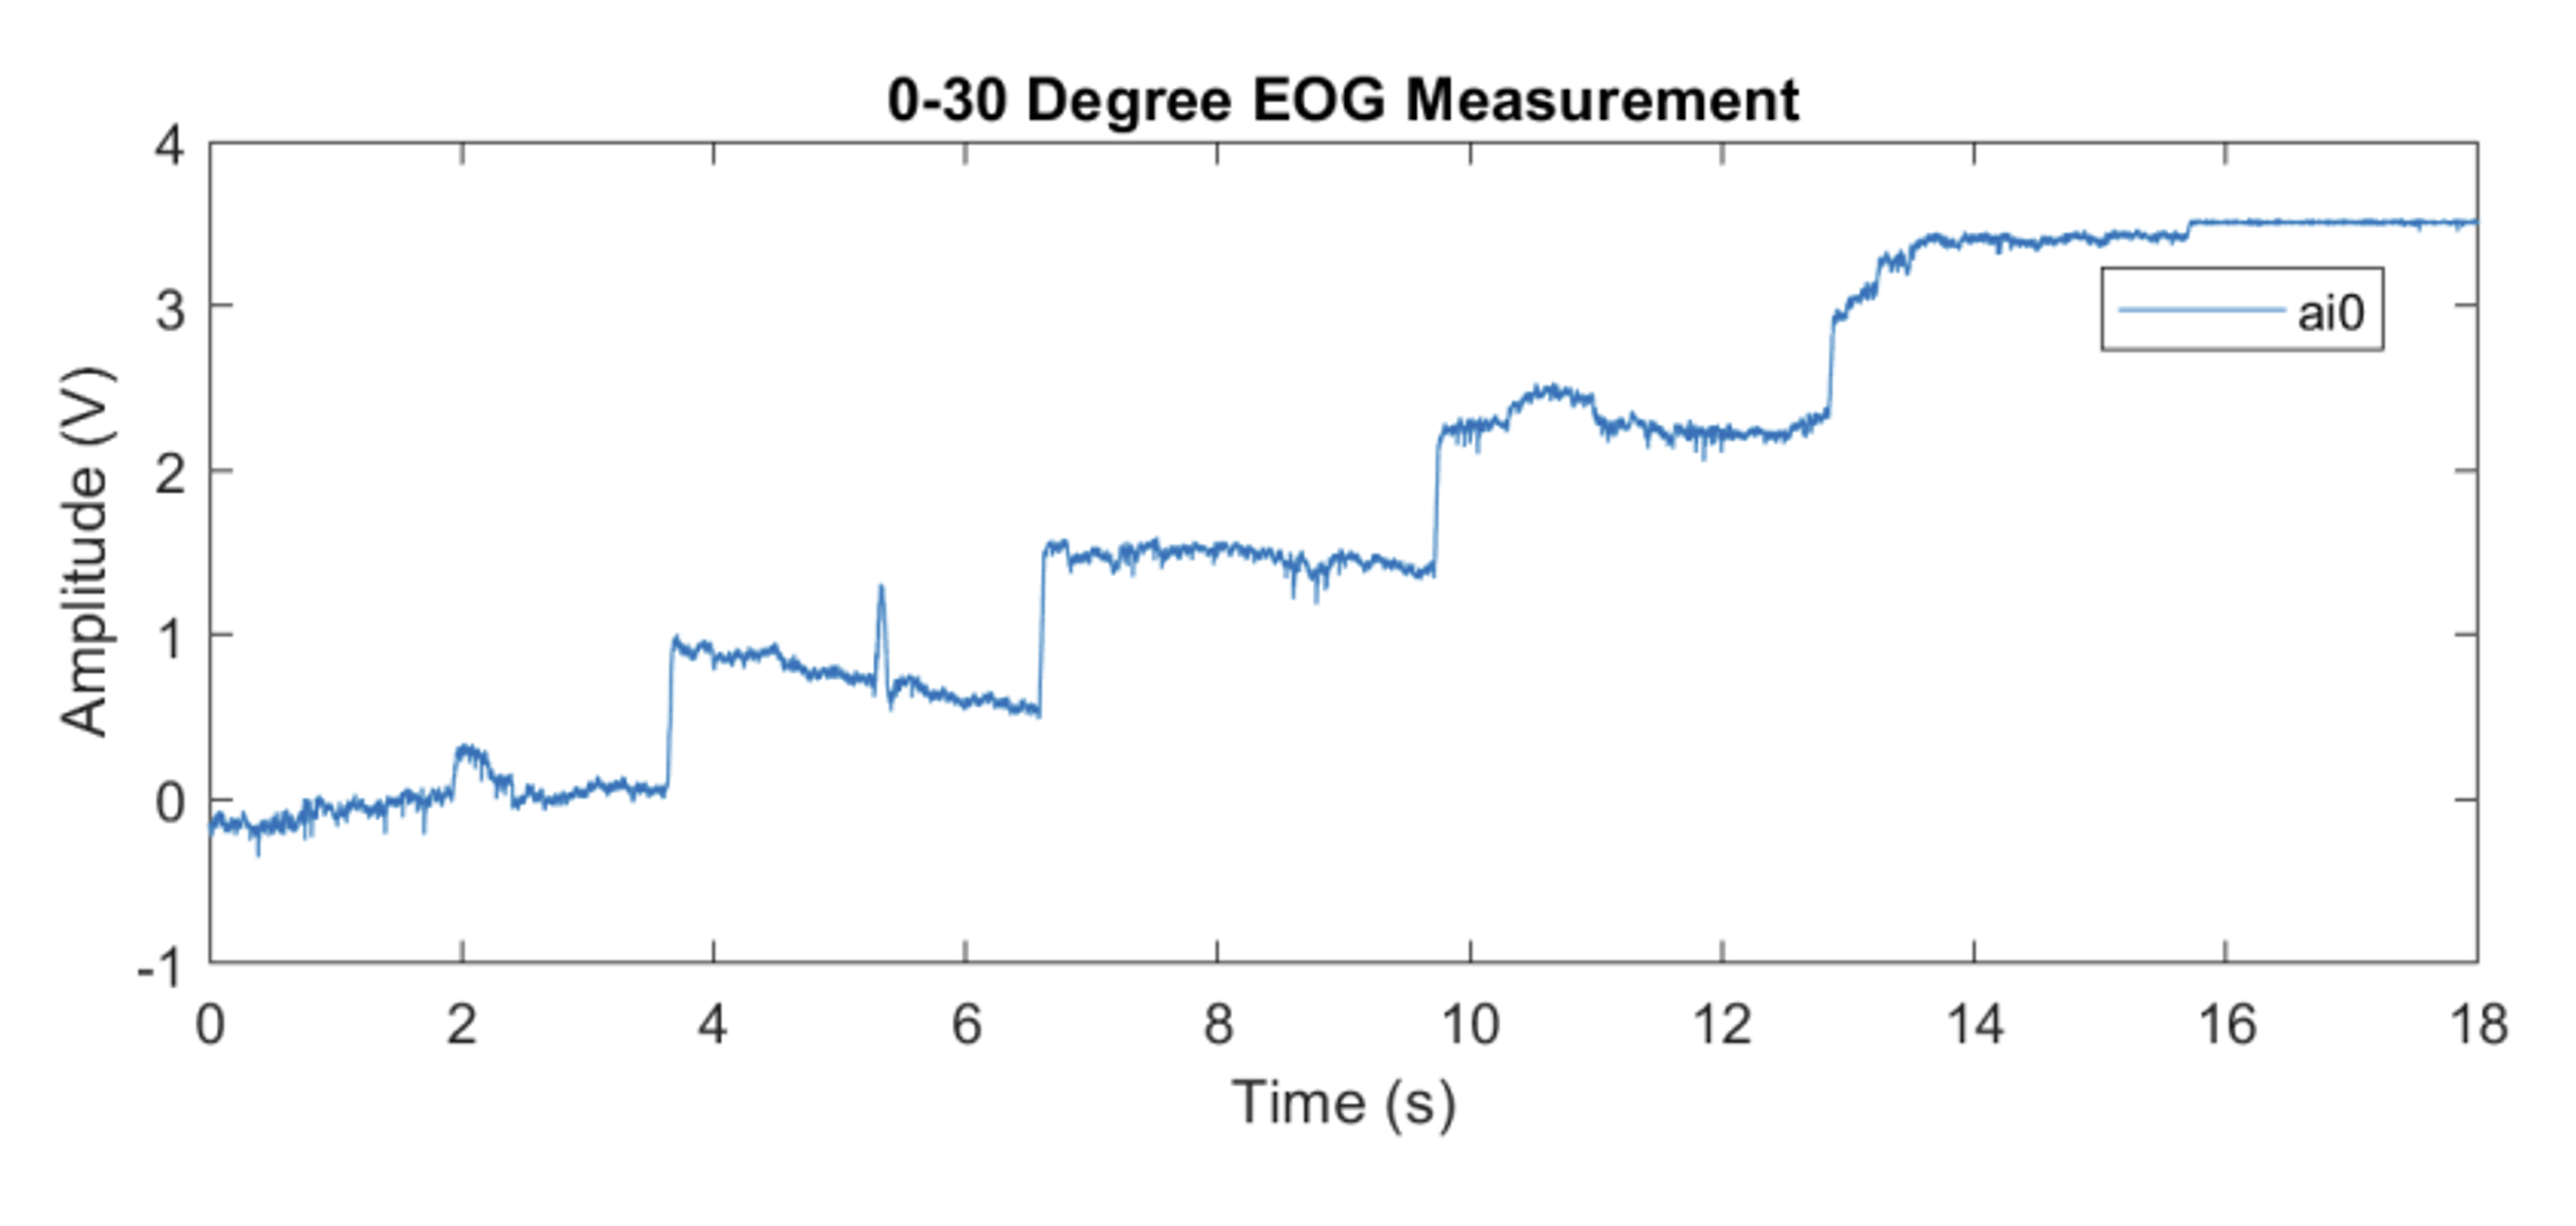
Voltage as a function of angle from 0 to 30 degrees.
Bonus Project: Built eye-controlled computer mouse with cursor movement and blink-to-click functionality (demo video)
Lab Reports
Team: Lauren Stephens, Sophie Mansfield, Jiaqi Du
Instructor: Dr. Qiyin Fang
| Course: IBEHS 4F04: Biomedical Instrumentation | McMaster University | September 2022 - December 2023 |